- What is the Zig Zag strategy?
- What is the best setting for this indicator?
- How do you trade with it?
The Zig Zag indicator is a valuable tool in finding real trends by filtering out market noise. Anyone can add this indicator on the chart as it comes in most trading platforms. Despite this fact, not many traders utilize this tool and make it part of their trading arsenal.
This tool can help reveal chart patterns that are somehow hidden by the candles on the chart. With it, you can easily see double tops and bottoms, head and shoulders, and other patterns in any time frame you are looking at.
In this article, you will learn quite a bit about the indicator. You will understand its use, default settings, tweak them, how the Zig Zag lines form, and how to trade with it.
Understanding the Zig Zag indicator
This tool draws lines on the active chart by connecting swing highs and swing lows. It is a valuable tool in identifying swings as price moves up and down. However, traders do not widely use the tool even if it is available on many trading platforms like TradingView and MetaTrader.
In MT4, the Zig Zag is included in the custom indicators folder. In TradingView, you can find it by searching in the Indicators pane. Once you do, select the first item that appears in the search result. After applying the indicator on the chart, you will see a line alternating between green and red colors, touching significant swing highs and swing lows.
Zig Zag indicator settings
The Zig Zag tool has three external parameters to adjust as necessary. The parameters are often termed deviation, depth, and backstep. The default values are 5, 12, and 2 in that order. Like other indicators, you can tweak these values to match your trading method. Be aware that the values are given in percent.
The parameters are explained below:
- Deviation (default = 5)
This is the minimum retracement from a reference swing that the current swing must reach before it is considered significant. This means that less than five percent of price retracements are not drawn with a line.
- Depth (default = 12)
The default value means that the indicator will attempt to find a new swing high and swing low if at least 12 candles are to the right of the last anchor point.
- Backstep (default = 2)
This is the minimum number of bars between a swing high and a swing low that the algorithm will consider.
How do the Zig Zag lines form on the chart?
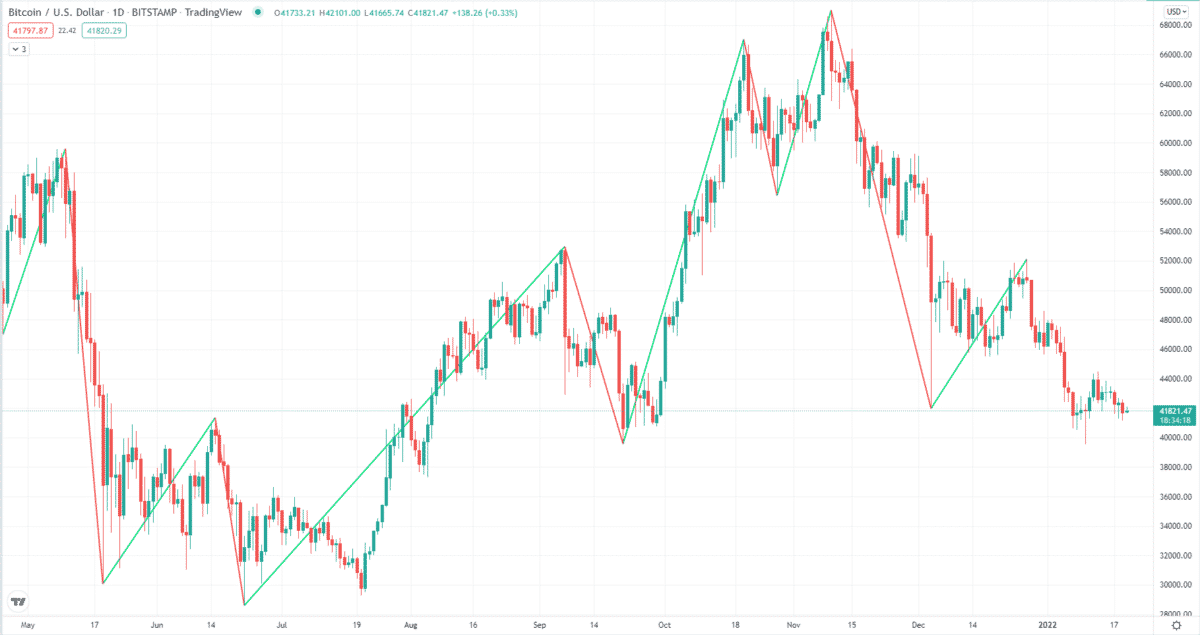
Understanding how the indicator draws lines is essential if you use it correctly. First, the indicator will select an extreme value in a range of 12 bars. The Depth parameter defines the number of bars. If the price has been moving up for a while and then began going down, Zig Zag will attempt to find a high in the range of 12 bars.
The height from the previous high to the current low is 100 percent. If the price moves upward at least five percent, the indicator will show a line from the current low to the recent high. If the current upward retracement is less than five percent and the price goes down, breaking the latest low, the line will move to the new low.
How to trade the Zig Zag tool?
Usually, this pattern is used alongside other technical tools to trade the market. Using it as a standalone trading tool is often not enough. Here we present one way: trading with the trend.
Taking buy trades in an uptrend
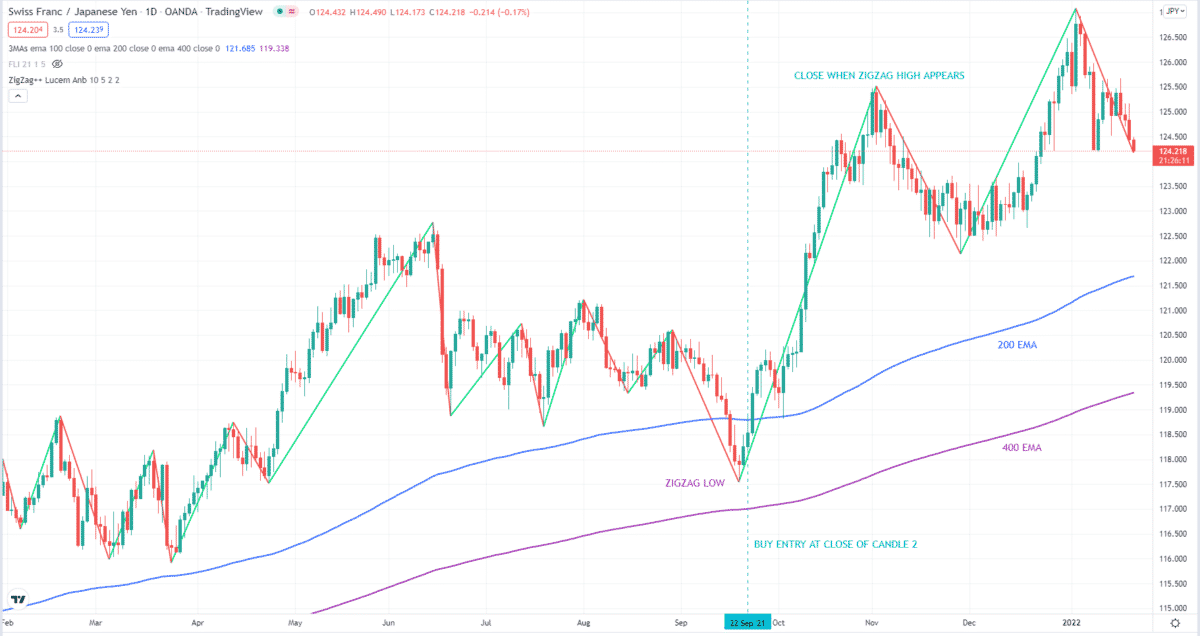
Here we consider an uptrend. We will use it with moving averages to trade along with the trend. Let us use long-term moving averages, particularly 200 and 400 EMAs, for this purpose. We will use the default settings of the Zig Zag.
In the image below, you can see the daily chart of CHF/JPY. This chart shows a market moving in a strong uptrend, judging by the direction, slope, and separation of the 200 and 400 EMAs. Once you see this type of market, whatever method you use, buying is preferred to selling. You can combine support and resistance or supply and demand to add confluence to your entry.
Here we will take a setup that forms when price makes a deep pullback into the moving averages. Once you see that Zig Zag is low, wait for two candles with higher lows to form. Once the second candle closes, you can enter the trade. Put your stop loss below the Zig Zag low, and do not set a take profit yet. Close the trade manually when you see a Zig Zag high forming.
Taking sell trades in a downtrend
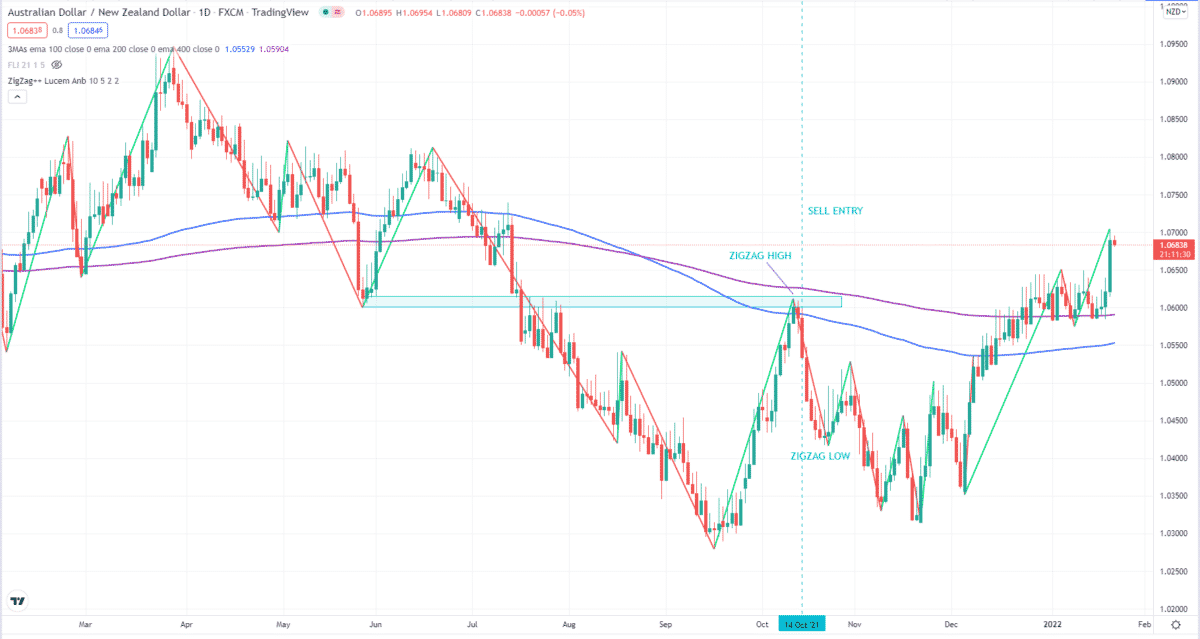
Here we consider a downtrend. Again we use the Zig Zag indicator in partnership with the MA. Let us use long-term moving averages, particularly 200 and 400 EMAs, for this purpose. We will use the default settings of the Zig Zag.
Below is the daily chart of AUD/NZD. The price dipped below the moving averages in the middle of the chart shown. This resulted in the shifting of the placement of the moving averages. After a while, the price retested the moving averages from below. This pullback ended at an apparent resistance.
When the tool registered a high, and the price made two lower-high candles, you are ready to sell at the open of the next candle. Put your stop loss above the Zig Zag high. Manually close the trade when a Zig Zag low appears, aligning with an obvious swing to the left. This sell trade is not as profitable as the previous trade, but it is worthwhile.
Final thoughts
The good thing about Zig Zag is its function to filter out noise based on your preference. While you can adjust any of the three parameters, simply tweaking the deviation variable can help you see the swings you would like to see and ignore small swings. You will love this stuff if you are trading price action. If you are looking to build an automated system, adding this indicator as one of the confirmatory tools can increase the profitability of that system.