- How do you trade a Triple top pattern?
- How reliable is a Triple bottom?
- Is it a profitable strategy?
The Triple bottom is a classical setup that usually forms at the end of a downtrend and presages a reversal to the upside. Unable to break support after three attempts, the price forms a Triple bottom. This suggests that sellers are exhausted, and buyers control the market action.
Samuraitradingacademy.com has studied about 200,000 chart patterns utilizing ten years of data. It found out that this figure has a win rate of 79.33 percent, which is 1.74 percent higher than the Triple top.
Take note that the Triple bottom appears and works on any time horizon. Because of the fierce battle between buyers and sellers, the pattern takes time to complete on the time frame you are watching. The main requirement is an initial downtrend.
In this post, you will understand the structure of the pattern, the key elements, and how to trade it in a standard manner and an alternative fashion.
Understanding the Triple bottom
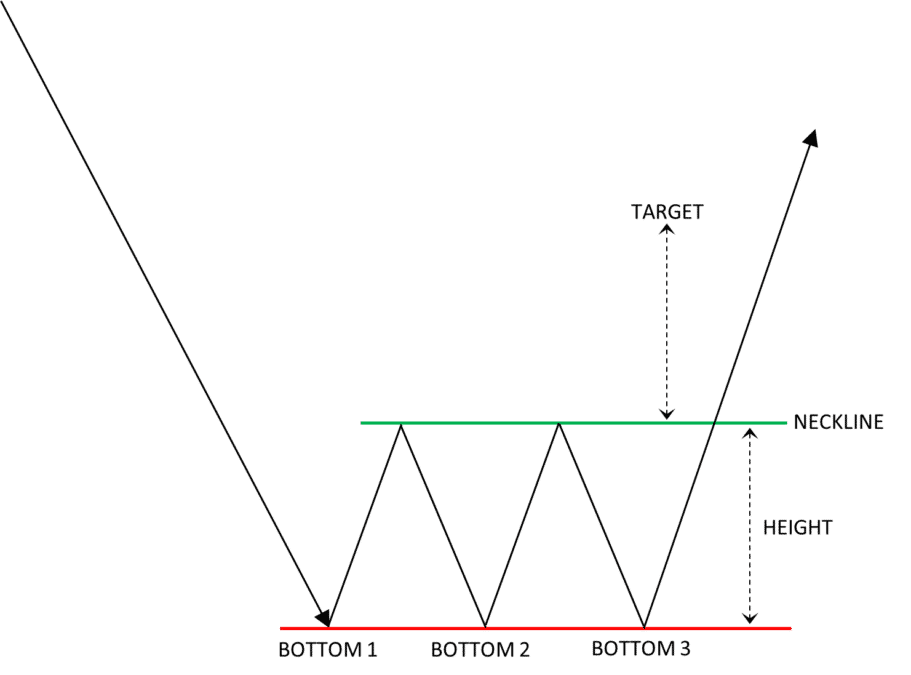
It is a bullish reversal setup. Having a success ratio of 79.33 percent suggests that this pattern is reliable. Because of its structure, you can easily find the setup on your chart. The most glaring component of the pattern is the three valleys forming at about the same level due to the failure to cross and close below this level three times. This means that the price has found a bottom or floor and is poised upward.
The Triple bottom forms in this fashion. Price has been moving down for a while and has started experiencing buying pressure. The sellers who pushed the price down may have already liquidated their positions. They not much remaining to push the price further down. Then price records a low that is immediately pushed upward. Then price retests the new low to break it down but fails the second time. It makes a third and final test, met by strong buying pressure. This fierce battle led to the neckline and support, as shown below.
Be aware that the Triple bottom is seldom perfect. It means that the three bottoms are rarely at the same level. Sometimes one or two bottoms will fall short or exceed the support level. This is all well and good as long as you see valleys forming within a tight support area. In stock trading, these valleys are accompanied by falling volumes, but this is not important in currency trading.
In summary, the figure has three key elements:
- Downtrend
The price must be going down before the Triple bottom formation. You could either see a straight sell-off or a step-down ladder formation.
- Support
This is a price zone or level where an attempt to break through is vanquished repeatedly.
- Neckline
This minor resistance area serves as an inflection point while price attempts to break to the downside. When the breakdown fails, a breakup of the neckline confirms the upside reversal.
How to trade the Triple bottom pattern?
If you know how to trade the Double bottom pattern, you know how to trade the figure. The process is much the same. Because the Double bottom is already a robust setup, Triple bottoms rarely show up. As you might have suspected, the figure is a little more effective than the double bottom by 0.78 percent, according to samuraitradingacademy.com.
Let us take a sample to show how to trade the Triple bottom. For this example, refer to the USD/CAD daily chart below. As a reversal pattern, the Triple bottom may occur in a downtrend or a pullback area in the middle of an uptrend. The setup below is an example of the second scenario. What is essential is that the main requirement of an initial downtrend exists.
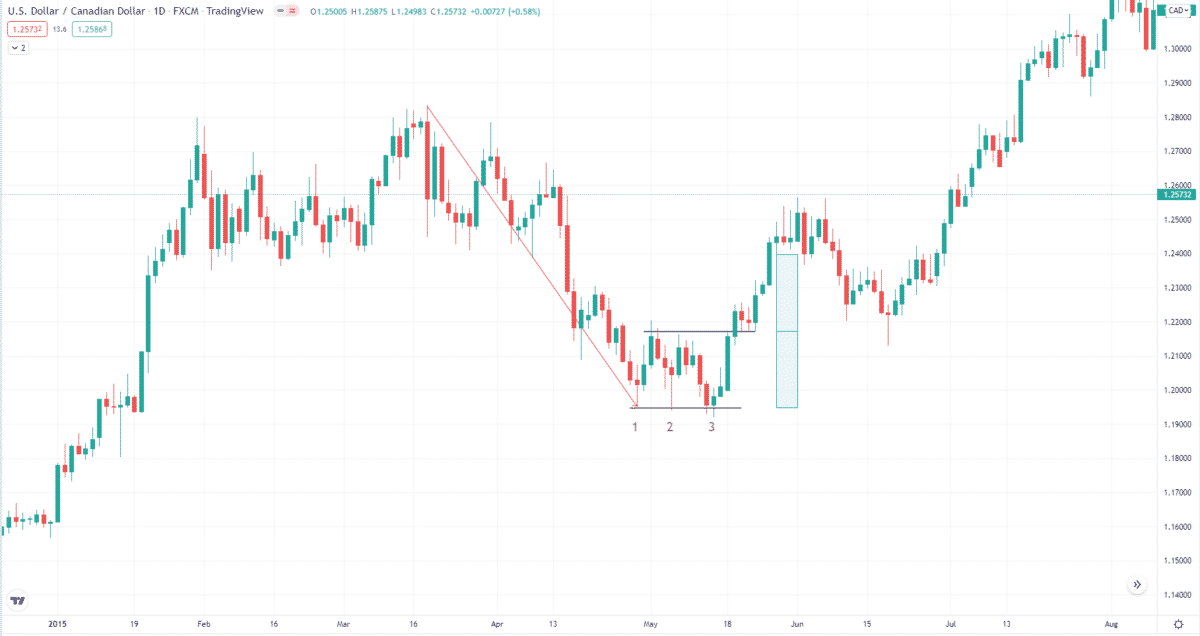
This setup is small on the daily chart, but it is more prominent on the four-hour chart. This setup is not standard because the neckline is not horizontal. You can even think of this setup as a descending triangle that fails to break down. After the third bottom is established and the price is moving toward the neckline, it is clear that a Triple bottom is in place, and you are looking for a buy entry.
The moment the price breaks above the neckline after the third bottom and closes beyond it, you can already enter the buy trade. Make sure that you wait for the breakout candle to close above the neckline. The challenge here is setting the stop loss and taking profit to get a good reward-risk ratio. One thing you can do is set the stop loss in the middle of the Triple bottom range and go for a target that is twice the risk.
Alternative buy entry
To ensure a better reward-risk ratio, you can use an alternative buy entry method.
- You can use a buy limit order instead of a market buy order.
- After you get a candle break and close beyond the neckline, place a pending buy limit at the neckline level.
- Then put a stop loss in the middle of the range and a take profit in the possible completion point of the setup.
This example shows that price retests the neckline from above before it eventually takes off. The downside of this entry strategy is that you could miss potential trades when the price does not turn around, which is possible. The upside is that you could get a favorable reward-risk ratio that would impact your long-term profitability.
Final thoughts
Once you know how to trade the Double bottom, it takes no learning curve to trade the figure. Since it shows up less frequently, this drawback is offset by a high success ratio. Trading the setup to the letter and keeping a high reward-risk ratio will give you good chances of trading success.
To apply this method in your trading, scour your charts and understand how to trade the setup in more depth. Trade with a demo account at first. Once you succeed in demo trading, you can move on to a real account.