- What is the WMA?
- How to identify it?
- How to calculate and trade with it successfully?
In almost all trading strategies, indicators remain the cornerstone. By analyzing historical price patterns and changes, traders can predict future market movements and make well-informed decisions.
You can access several indicators today, but the Weighted moving average (WMA) remains widely used. That’s because its formula is straightforward, and its ability to measure market movement is excellent. Here is an explanation of what is meant by WMA. Furthermore, we’ll go over how it’s calculated and look at a detailed example.
What is the Weighted moving average?
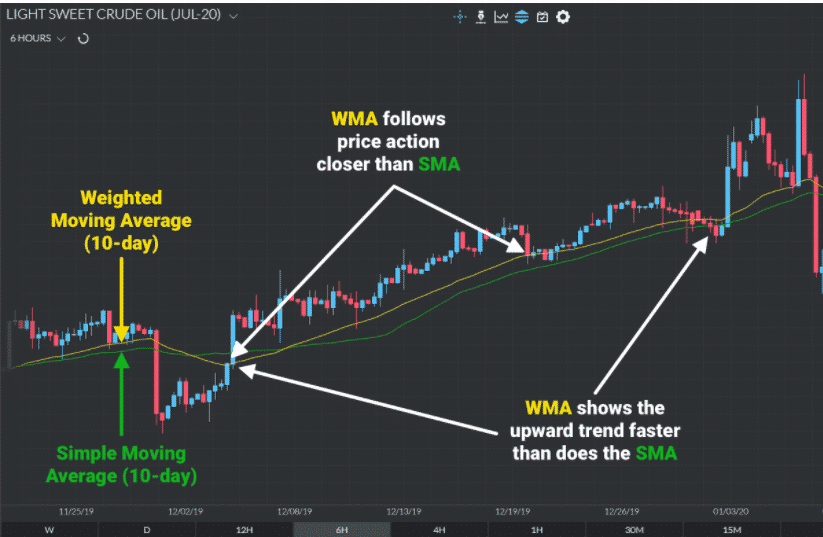
It determines the trend direction based on technical indicators. We average the data points from recent days, and past days are de-weighted to create trade signals. Close prices are typically the data points used to create trade signals. Thus, its accuracy is greater, and it’s step-up over the SMA; we give equal significance to all the data points in the data set.
It calculates an average of input values over specified times by giving greater value to more recent data. Then, the weighting factor is multiplied by the prices of each bar within a set. The sum of the results calculates the bar’s value. In turn, it smoothes out the data series to help traders pick out aims by filtering market noise.
In some cases, when the price goes above or nears the WMA line on the chart, it could indicate an impending price drop in the short term. Therefore, investors should close out their positions. Nevertheless, if the price dips below or just above the WMA line, it could indicate that the price will rise soon. In this case, now is the right time to trade.
Let’s consider a brief history
According to Alexander Elder, anti-aircraft gunners were among the first to use moving averages during the Second World War — they used movings to aim guns at aircraft. But who exactly is the author of the very first indicator is unknown.
Some of the earliest prominent MA experts were Richard Donchian and J. M. Hurst. Donchian (1905-1993) — American trader, analyst, businessman, was an employee at Merrill Lynch, where he created a strategy for working with multiple MAs. Under the influence of the book “Memoirs of a Stock Market Speculator,” he became interested in financial markets. After the losses incurred in 1929 during the financial collapse, he became closely involved in technical analysis.
Hirst was an engineer by training. In addition, he was actively involved in stock exchange business. Described the principles of using movings in stock trading. Thus, it can be assumed that the moving average indicator already existed in the middle of the last century, and it is undoubtedly one of the oldest technical indicators.
How is it calculated?
When calculating these indicators, recent data points have greater weight than historical data points. Therefore, the total value of the price should equal 100% when all of them sum up.
The calculation of this one differs from that of SMAs, where all data points are equally balanced. An SMA shows up by adding the data points over a given period and dividing the result by the number of periods. Unlike the SMA, which places equal weight on each data point, the WMA emphasizes each.
In this sense, this one is more descriptive and therefore provides a more detailed analysis than the SMA. in addition, it responds more quickly to price movements than the SMA.
WMA formula
The following formula is used for the calculation.
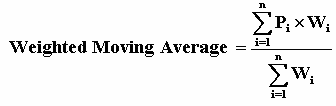
The formula may look daunting, but it is surprisingly simple:
- P value is the price of the asset in a certain period
- W value is the specific weight
It is not difficult to calculate the WMA manually, which we will prove with the following example.
The asset price from the first of May to the fifth of May.
| Date | Asset price |
| 1st of May | 102 |
| 2nd of May | 105 |
| 3rd of May | 107 |
| 4th of May | 106 |
| 5th of May | 109 |
It is necessary to determine the value of the WMA for the last five periods.
Substitute the values into the formula:
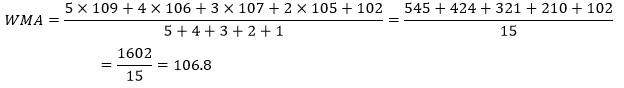

In reality, the average is not considered for five periods since such an analysis gives a too subjective result. However, carrying out more massive calculations manually is problematic and takes a long time, so we can thank the computers for doing this work for us.
Final thoughts
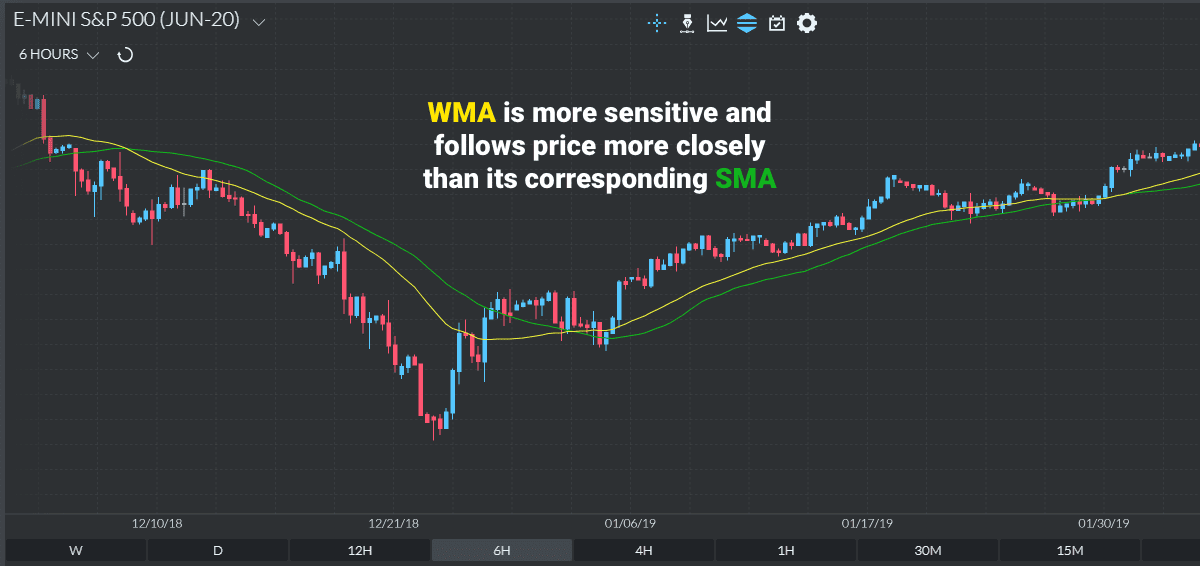
Considering elements’ importance (weight), WMA is more sensitive to price changes than a simple moving average, allowing faster signals to enter and exit the trend.
However, like any other MA, the weighted one is also an unavoidable delay. It is best used in short-term and medium-term strategies since the last price values are the most important. Simply put, this indicator looks smoother on high time frames due to the low market noise, and it does not give such clear signals.
Further, you may want to adjust your settings slightly for each market. For example, one stock with a 50-period WMA may give good signals, but not another. To get the best results from your trades, you need to know how to interpret and use the WMA, just as you would any other tool.