- What are the chart patterns?
- What do they tell us about the market?
- Is it right to rely on the information provided by them?
Human emotions like fear and greed heavily influence stock prices. Emotions are predictable when a stock’s price increases and falls, and these emotions may lead to predictable charting patterns.
As a result, technical analysts may have the edge over investors who tend to make decisions primarily on emotions like fear and greed since they trade stocks only on patterns shown in charts.
Though predictable, these patterns do not guarantee success. Bull traps, head fakes, and failed breakdowns are all too prevalent, and they tend to spook traders out of their positions just as the big move is about to occur. Because of this, technical analysis is very demanding.
What are chart patterns, and how do they work?
There are several patterns that traders use to judge the market’s sentiment. These insights are combined with technical indicators and candlestick patterns to aid market participants in making trading choices.
Trend lines link high and low points in most chart patterns. Prices are more likely to react as psychological barriers as they approach trend lines if they have previously reacted to trend lines or a significant volume.
Contrary to popular belief, chart patterns may be used to predict one of two things:
- After a short time of consolidation or corrections, the price of a crypto asset may restart its upward trend.
- When a reversal is conceivable, the price of an asset may reverse and move in the opposite direction of its current price trend.
Traders build them with the hope that they will occur and whether or not these expectations are self-fulfilling. The good news is that you don’t need to be a crypto specialist to see these trends. On the other hand, other simple chart patterns may be employed by both rookie and expert investors.
Triple & double tops and bottoms
This chart pattern happens when prices bounce off the same resistance or support level three or more times in a row.
For example, the triple and double reversal patterns signal that prices are poised to reverse direction. When the price of a crypto asset climbs and then encounters a significant resistance level, a double top is formed. Afterward, prices decline for a short period before increasing again. It’s deja vu when prices hit the same resistance level for the second time. A price reversal is less probable if prices break above or below the resistance.
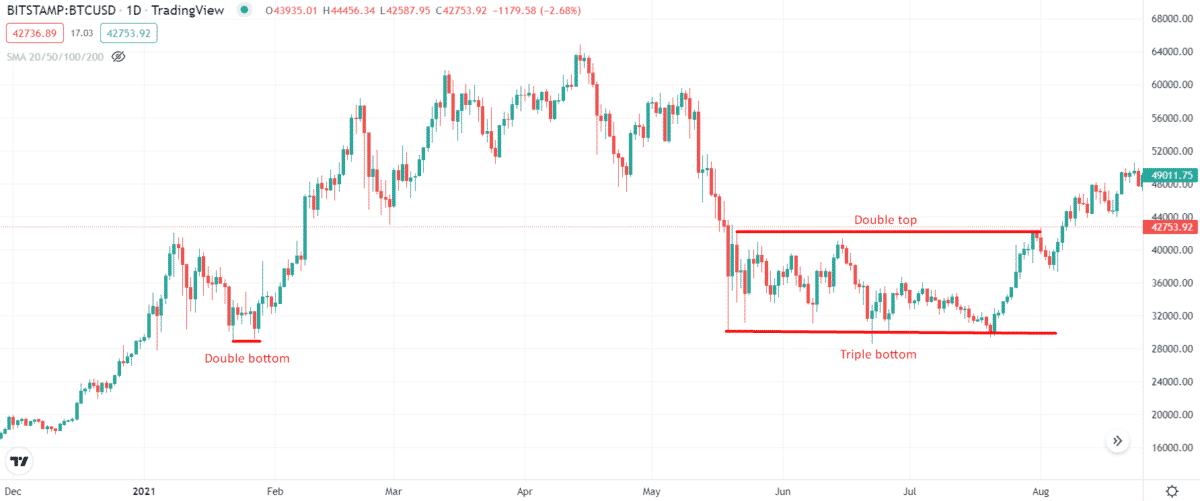
Triple patterns are more common when price reversals than double tops and bottoms.
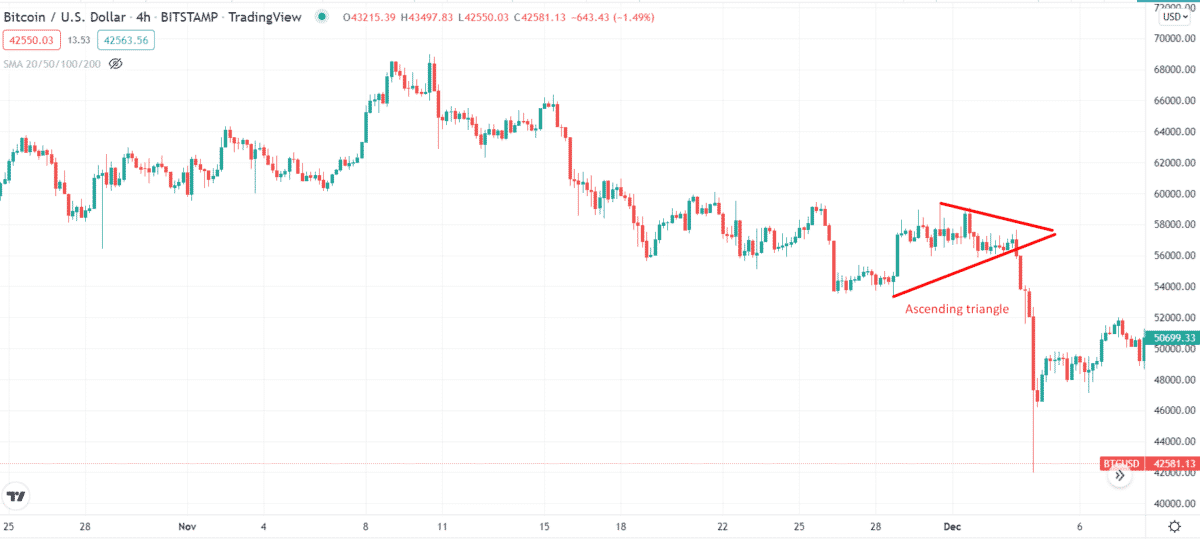
Ascending/descending triangles
Consistently rising and falling patterns are shown on the charts. For example, an ascending triangle is formed by drawing a line linking the recent price highs with a diagonal line connecting the lower price lows.
When bullish traders continually reject the same resistance level but recede less each time, the price finally smashes through them. Prices fall as sellers finally break through base support after a series of setbacks.
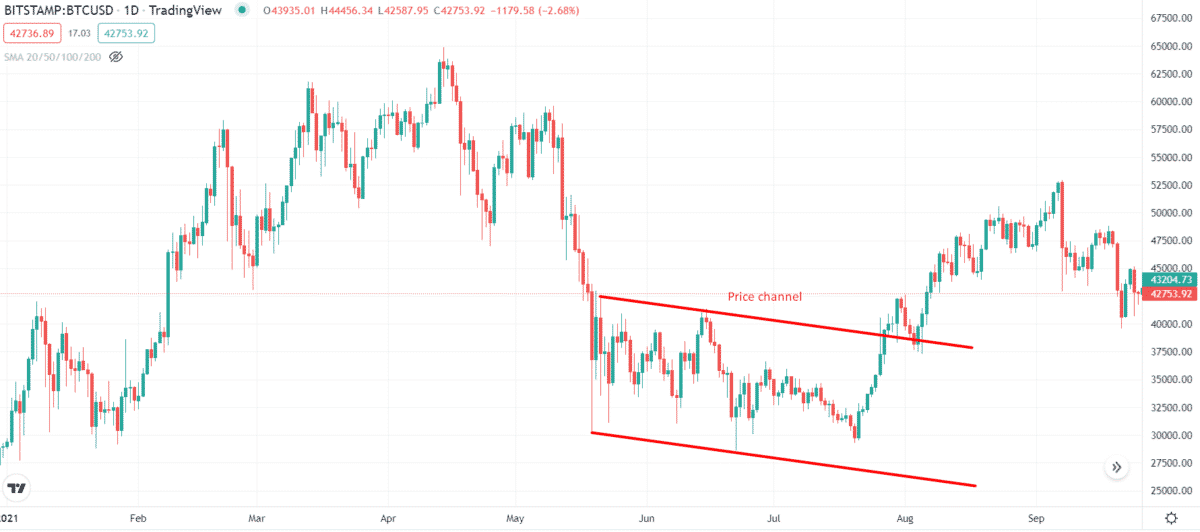
Price channels
Ascending, descending, or horizontal parallel lines link a series of highs and lows. Between these levels of support and resistance, prices tend to sway (higher). Trading at the bottom and selling at the high is the most common strategy most investors use.
Except for a false collapse at the end of May, the price in the following example fell steadily for two months. To earn a profit, traders would have bought low and sold high at this time, or they would have held a bearish position until mid-July when the pattern broke out.
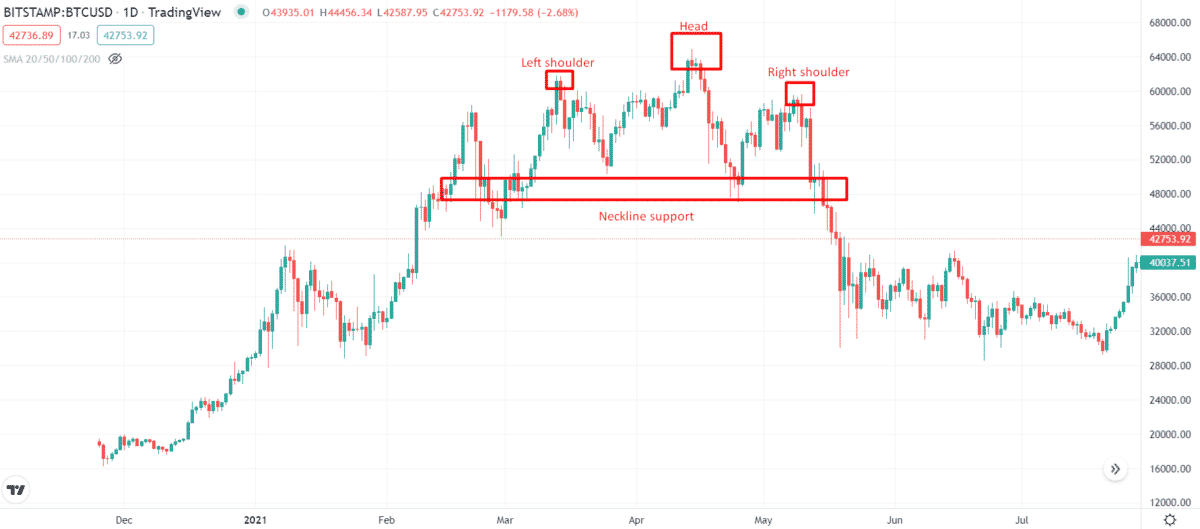
Head and shoulders/inverse
Another reversal chart pattern is the head and shoulders (H&S) configuration, which has three consecutive price peaks. A more prominent core peak is flanked by two lesser peaks known as “shoulders” (called the “head”). In many charts, the “neckline,” a flat line connecting the lower lows of each peak, is visible.
The price breaks out after the final growth of the shoulders and the return to the neckline. A negative reversal is inevitable when all three peaks trend higher. When all three peaks point downward, an inverted H&S pattern is formed, indicating the start of a new uptrend.
When BTC trade volume is substantial, chart patterns are more common to appear.
Trader Daniel Chesler claims that “more volatility aligns in the early phases of chart creation.” Thus, when the market is more active, more interest in it means more supply and demand.
Remember that no chart pattern can guarantee to be 100% accurate, especially during moments of solid trading. Because of the low volatility in the market, many traders choose to wait for a breakout or breakdown to be confirmed or use SL to limit this risk.
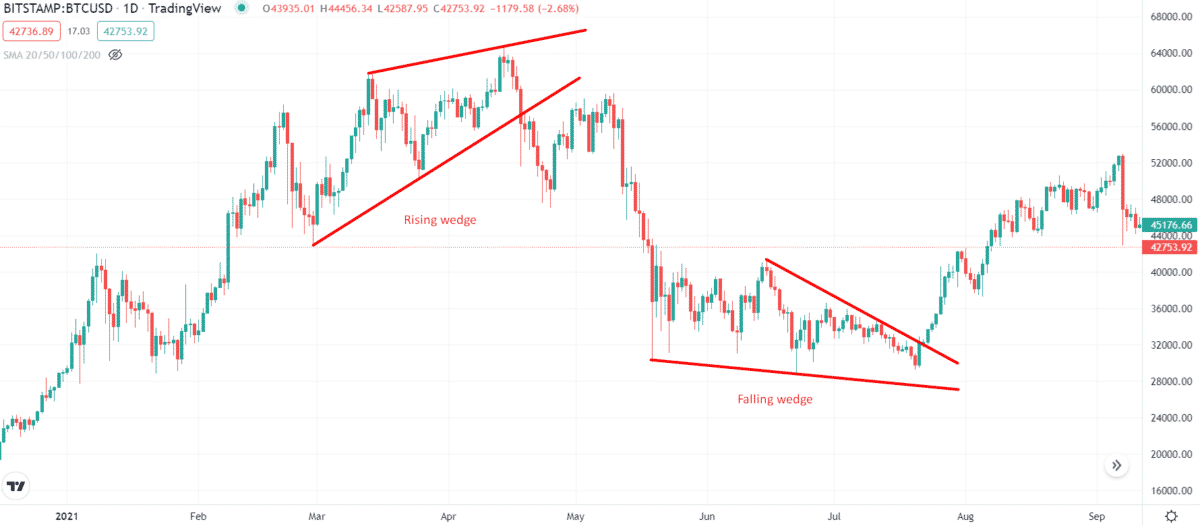
Rising and falling wedges
One way to tell if the market is going down or up is to look for an upward or downward wedge pattern. Ascending and descending wedge slopes resemble ascending and descending triangular slopes in their characteristics. Unlike ascending and descending triangles, rising and falling wedges are reversal patterns.
The bearish rising wedge pattern in the following example suggests a short-term price decrease inside a longer-term price increase. Traders would have taken a short position as soon as the lower trend line was broken and made a little profit before the uptrend rebounded in the next few days.
Final thoughts
Although chart patterns may assist traders in getting insight into market sentiment, they should not be relied upon as a solitary source of information. To achieve the best results, you need to understand market elements such as technical indicators.