- Can you trade bullish and bearish setups using the golden/death cross?
- What is the difference between these strategies?
- Can you earn by using the crypto golden cross indicator?
While there are many arguments surrounding the validity of the technical analysis, for many investors, it is a critical tool for predicting future stock price movements. Golden crosses and death crosses are standard technical analysis tools. Can they be valuable?
What is the golden/death cross in crypto?
You will need to read chart patterns, candlestick patterns, and several other indicators to start your trading journey. Nevertheless, never expect a guaranteed outcome.
Critical indicators for identifying a trading chart include the golden and the death cross. You can take your game to the next level by understanding these chart patterns, whether you are a long-term investor or a day trader.
Before we delve into further detail about the GC and DC, let’s first look at the two symbols.
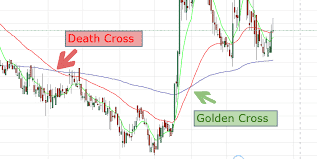
Traders and analysts expect a final upward turn in a market when short-term intersects over long-term MAs to the upside. When long-term and short-term norms, the short-term average trend rises faster.
Similarly, a downside MA crossover signifies a definite downward trend known as the DC. It occurs when the short-term goes down and intersects the long-term average, going the other way from the golden cross.
How to trade?
A relatively simple concept underlies this strategy. Understanding how people use the several tips will help you trade these crossover signals more efficiently.
We often talk about GC and DC when talking about the daily chart. So, it would make sense to buy shares when the prices decrease and sell the cryptos when the price increases. As it turns out, this would have been an effective strategy for Bitcoin in recent years, even though the market had many false signals along the way. It is, therefore, not a good idea to blindly follow one sign. Consequently, it may be worth considering other factors when analyzing the market.
Traders looking to trade golden and death crosses will also consider the trading volume. The volume can act as a confirmation tool for chart patterns just as it can with other designs. Consequently, many traders are more likely to take a crossover signal seriously if a volume spike accompanies it.
As soon as a golden intersection occurs, long-term moving averages (MA) may serve as support areas. However, as a result of a DC, it may also serve as a potential area for resistance.
Characteristics
The following three things are necessary for the formation of the golden cross.
- Stage 1. It shows a stock price downtrend.
- Stage 2. When an SMA crosses over a long-term average, then, the price breaks out of that trend as a reversal becomes likely.
- Stage 3. It may not happen even if the first two have. A continued uptrend marks it as stock prices rise.
The following three things are necessary for the formation of the death cross.
- Stage 1. As long as the price trend is up, the position of the SMA will be above the long-term MA.
- Stage 2. Then the trend reverses, and the SMA will cut the position of the long-term MA.
- Stage 3. A downward price shift occurs when the long-term MA is above and the short-term MA remains below.
Sample of the golden / death cross crypto trading strategy
There are differing opinions about what constitutes a meaningful convergence in moving indicators. Analysts differ in their definitions of the crossover. Some define it as the crossover of the 100-day MA by the 50-day SMA. Others describe it as the intersection of the 200-day by the 50-day MA.
Analysts also watch intersections on lower time frames to confirm an ongoing strong trend. No matter how the term is defined or the time frame used, it refers to striking a shorter-term moving average over a longer-term one.
Bullish trade setup
Please take a look at the picture below to understand it better. As you can see, the 50-day MA was significantly lower than the 200-day MA. As a result, the market has performed considerably worse than it did over the past 200 days.
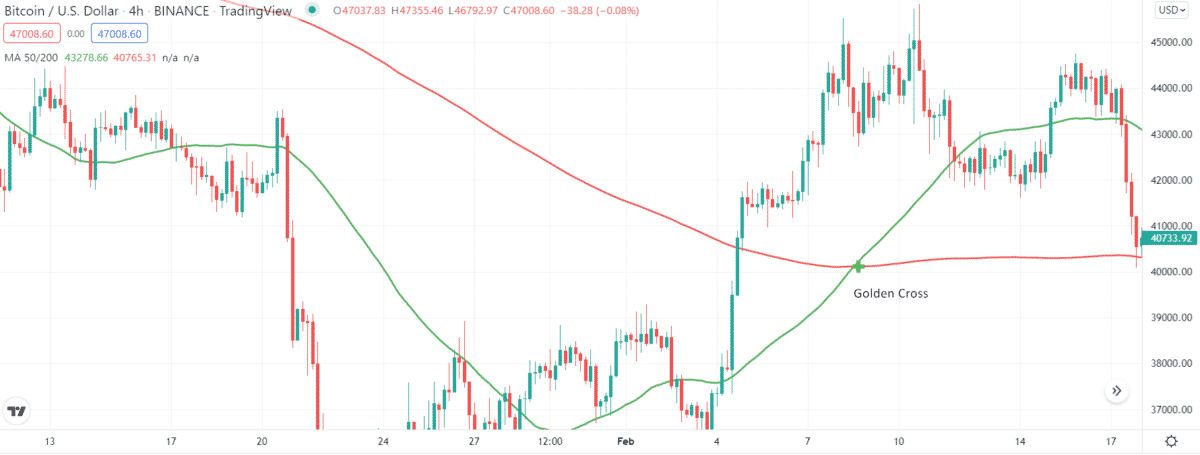
The market has recovered once the 50-day over the 200-day, and a bull run is about to begin. At that point of intersection is the golden cross.
Here are some possible scenarios for the strategy:
- The market has stagnated for a long time, and you have been losing money.
- Keep your eyes peeled for golden crosses.
- Market participants invest in the market before they realize the golden cross has appeared.
- Suddenly, the market begins to recover, and everyone starts to reinvest.
- The market has been pumped up and is ready for a bull run.
This scenario is much more profitable when the MA is in days instead of minutes. However, it is challenging for even experienced traders to succeed due to extreme volatility in the day trading market. It is, therefore, wiser to use a 50-day and a 200-day MA in place of 15-minute MAs and 50-minute MAs.
Bearish trade setup
The illustration below shows that the 50-day MA does a hard stop at the 200-day MA. In other words, the market was in a better position in the past 50 days than it had been in the previous 200 days.
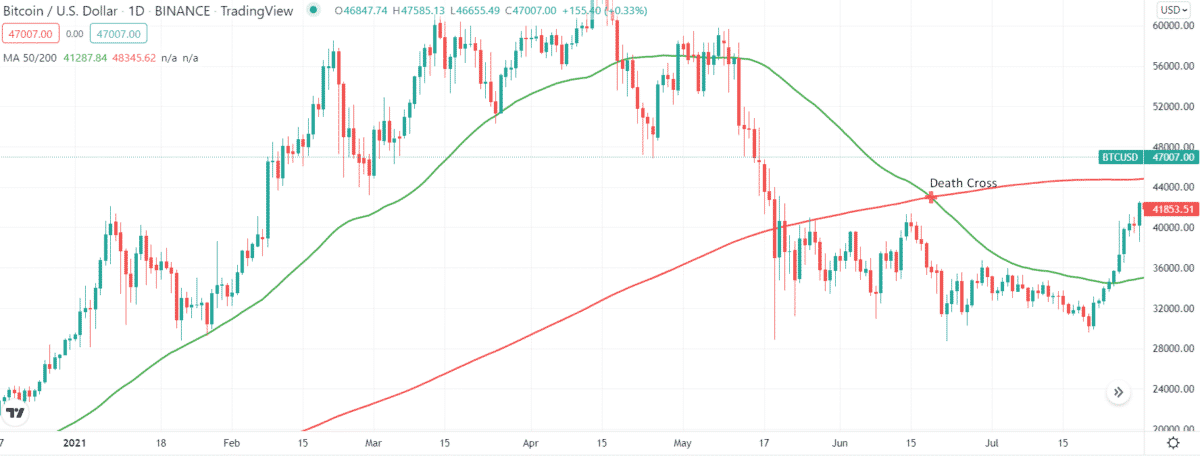
Although death crosses can serve as a valuable indicator of a market decline, there is no guarantee. A downtrend should occur as soon as it collides with the 200-day MA and stoops further below that level. It’s ok to assume a risk-averse strategy and exit the market early, but believing in the outcome 100% is not the best decision.
Final thoughts
Various patterns may offer educated investors opportunities in the market, such as the bull flag pattern, bear flag pattern, shooting star, and a variety of others. However, they all come with a mixed bag: risks of loss and the possibility of gains. This is why understanding the patterns thoroughly is recommended before trying them out.