- What is the pattern?
- Why is it worth using?
- What are bearish/bullish setups?
This bearish pattern occurs in an uptrend and defines a price decline. A little body with a long bottom wick and little or no top wick makes up the pattern. It resembles the letter T in appearance.
What is the Hanging Man pattern?
The pattern depicts the bulls losing control and the market plummeting, indicating the bears’ domination. Its extended lower wick indicates a big sell-off, pushing the price lower before buyers drive it back up to opening levels.
The longer the lowest wick of a candle, the more effective the pattern becomes, according to Thomas Bulkowski’s book Encyclopedia of Chart Patterns. It is a bearish pattern. However, the candle may be either bullish or bearish. On the flip side, a bearish candle is a better indicator of a downward market.
On a chart, it appears like this.
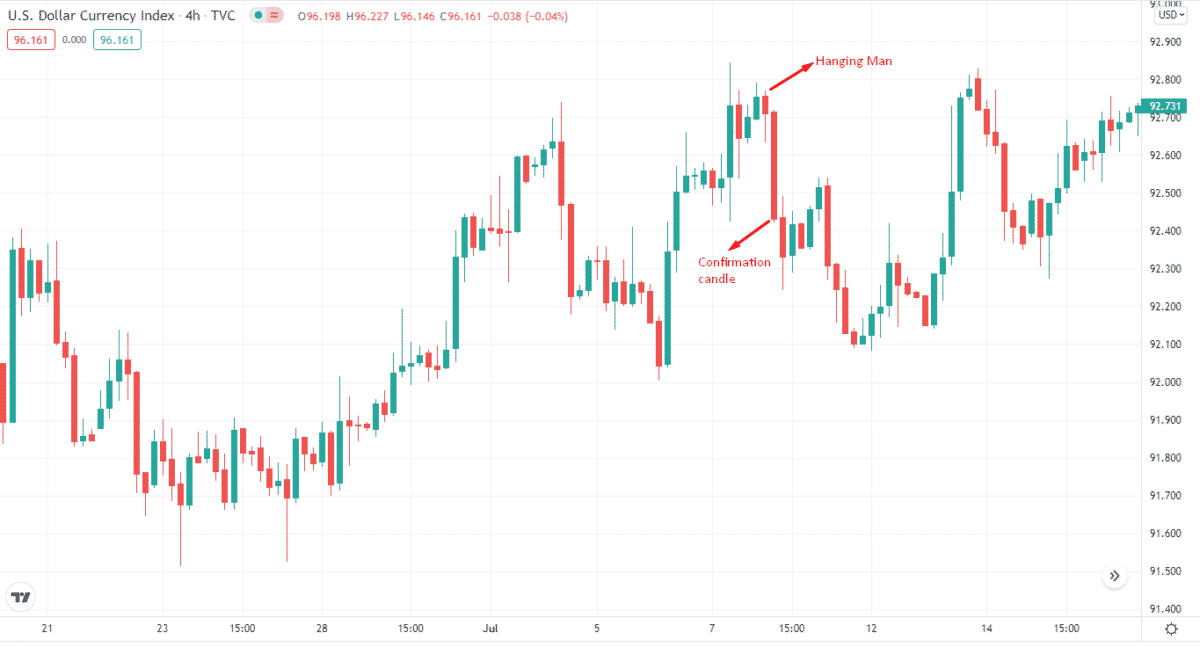
Observe there is a confirmation candle next to the Hanging Man. Along with it, this confirmation candle indicates a price decline. If there isn’t a confirmation candle, you should avoid trading the pattern.
Sometimes it confused with the Shooting Stars and Hammer patterns. The Hanging Man’s opposite is the Shooting Star. It appears upward with a lengthy top wick and little or no bottom wick. Although the Hammer has a long lower wick, it looks to decline.
The pattern can appear on charts with periods ranging from one minute to monthly. It occurs on the FX charts regularly.
How to identify it?
The candle pops up when the open, high, and close are all at the same price. There is a lengthy shadow to the downside. This wick, or shadow, should ideally be at least twice the length of the body.
It develops near the top of an upswing since it is a bearish configuration. Despite the high closing price, a lengthy shadow that stretches downward indicates that the market is becoming increasingly bearish.
Why is the pattern worth using?
Because the pattern only provides short-term reversals, you must trade it with caution. Short the candlestick when you see it set an SL at the peak and exit when the price rises. Later, we’ll go over the bearish and bullish setups in greater depth.
Because it does not provide price targets, it is preferable to exit the trade if the price rises. Remember that the pattern is a short-term prediction of a reversal while trading it.
Because the rising price trend lasted for a short period after the appearance of the Hanging Man, Bulkowski indicated that it is unreliable. Aside from that, there’s no guarantee that the price will fall when this technical figure appears on the chart. So to manage risks, you should set your SL order above the pattern’s high.
Bearish trade setup
You need to locate the candlestick in an uptrend for the bearish setup, wait for the confirmation candle to appear, and then take a position.
Best time frames to use
For trading the pattern, most market participants use multiple time frame analyses. It suggests you’ll need to search for the pattern over a longer time frame before determining the entrance point during a shorter time frame.
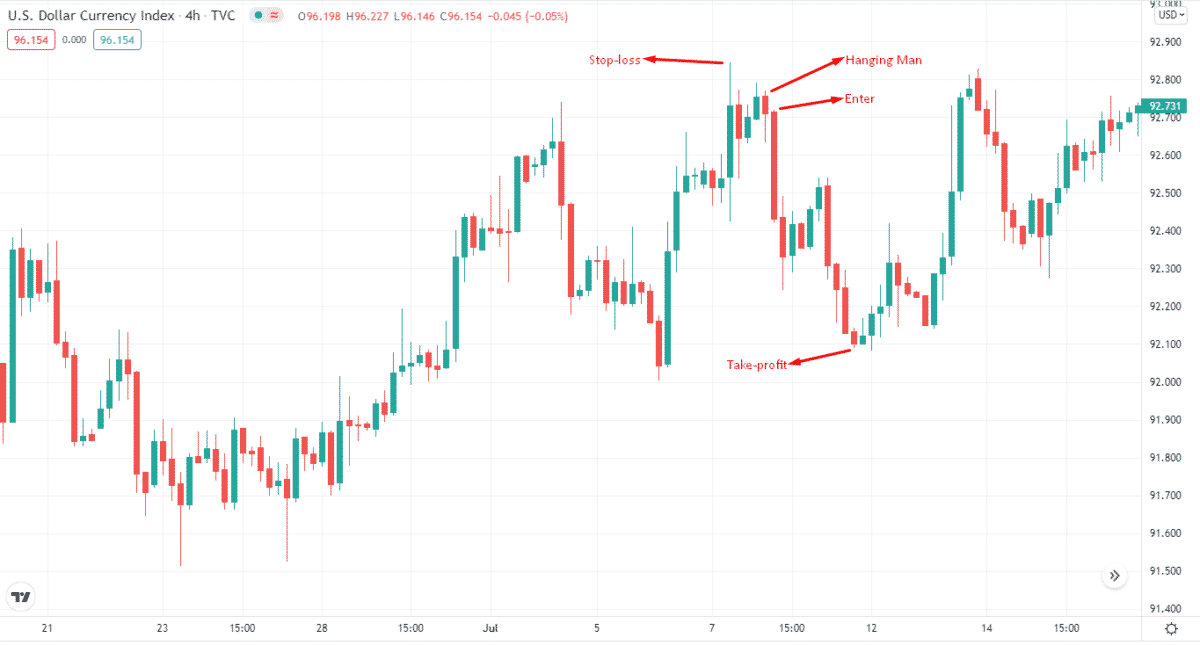
Entry
To enter the trade, you need to enter at the confirmation candle, as the trend can move against your direction.
Stop loss
You can set the SL above the recent high of the pattern.
Take profit
One disadvantage of candlesticks is that they do not give price targets. So, you have to continue in the trade as long as the downward momentum persists. Then, contrarily, exit when the price begins to climb again.
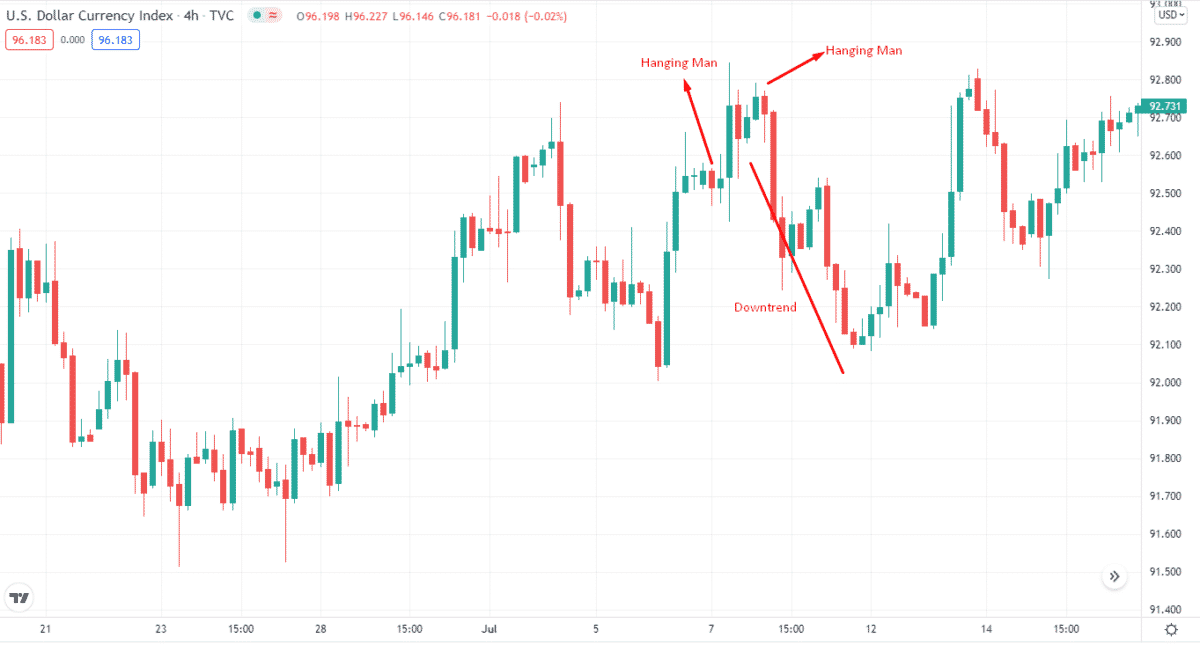
A EUR/USD hourly chart is seen here, with the market movement moving upward. Because a pattern is a bearish reversal, the trend must always be favorable and bullish.
Two Hanging Man candles develop in a short time. The first candle suggests a possible reversal, verified by the following long bearish candle.
Because of the unstable price action, the price continues to trade in a hazy way. Price movement then produces a second Hanging Man pattern, followed by a bearish candle.
How to manage risks?
You have to make sure your trades are in line with your position size approach. Consider how much of your account’s overall worth you’re willing to risk at any one time and stick to it. You can risk 2% to 3% per trade. Also, make sure your stop is at the highest point of the pattern.
It is usually advisable to have a risk-to-reward ratio of at least 1:2 when starting a transaction. This is because you’re putting half of everything you’re hoping to acquire at risk. It means that the distance between your entry and take-profit levels should be twice as long as the distance between your entry and SL levels.
Even if you only get half of your trades right, you’ll still have a positive trading account if you use this simple approach.
Final thoughts
This pattern appears regularly on the charts and is a price reversal interpretation. Set an SL at the most recent high if you wish to trade it. It would help if you used it in conjunction with other indicators in your trading methods.