- What is Bitcoin?
- What are double top & double bottom?
- How to trade BTC using these two patterns?
Trading in any form depends a lot on the overall volatility of the asset. For those new to trading, volatility is one such thing to check before trading any asset. To be specific about Bitcoin, the king of cryptocurrency is the most volatile crypto.
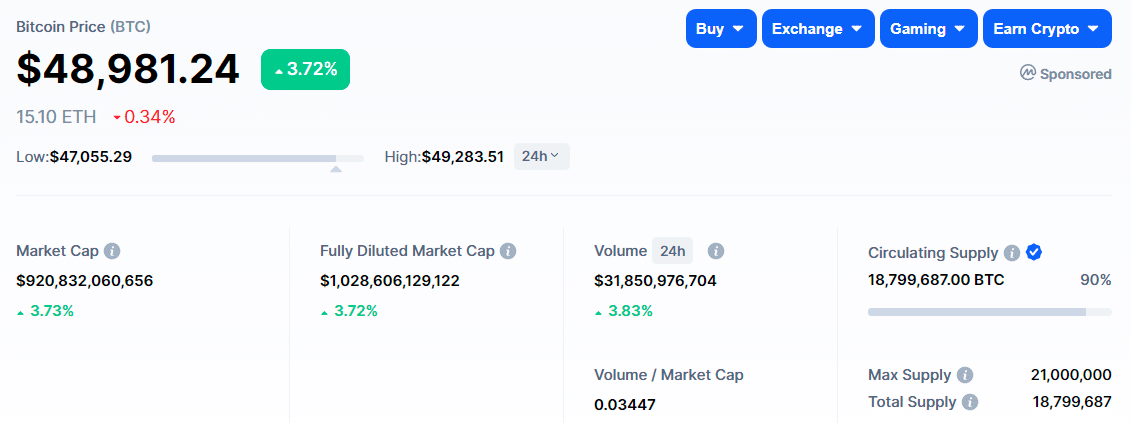
Bitcoin currently has a market cap of around $736 billion. That’s far greater than Ethereum’s $277 billion market cap, the second-largest cryptocurrency by market cap.
Trading Bitcoin is not easy as it depends a lot on the overall fundamental news and its volatility. As this crypto industry has not been around for too long, it does not give an excellent idea of the overall market movement.
Trading is a tough job compared to investment, but at the same time, it’s worth it. While you may use any strategy to trade Bitcoin, some specific patterns are accurate and give you trade setups to secure big profits.
Let’s discuss trading using a price action pattern called double top and double bottom.
What is Bitcoin?
Already famous for being the first cryptocurrency, BTC is a decentralized virtual currency used as a medium of exchange for goods and services just like your local currency, say USD, EUR, GBP, etc.
Bitcoin is made using a highly secure and robust distributed network technology called the blockchain — a stable ledger that promotes tracking and recording of transactions.
Bitcoin is in digital form, and so you cannot see, feel, or touch it. It was made in 2009 by an anonymous person. Bitcoin is decentralized, meaning it cannot be hampered or does not need authority from any government body and hence is available to use for everyone.
Bitcoin is ranked 1st on CoinMarketCap with a total circulating supply of 18,799,687.00 BTC coins.
What are double top and double bottom?
No doubt, price action is the leader of all trading strategies, but at the same time, it takes a lot of practice, consistency, and backtesting to get it right. Double top and bottom are price action patterns that do not need any indicator to trade.
Double top validates when the price goes up, touches the resistance zone twice, and cannot break it, showing a potential bearish reversal signal. While the double bottom is valid when the price moves down, it touches the support zone twice and cannot break it, showing a potential bullish reversal signal.
The double top and bottom is a reversal pattern, and identifying it in a higher time frame gives a more accurate trading signal with a good risk: reward ratio.
How to trade BTC using double top and double bottom
After learning the basics of double top and bottom, let us show how to trade Bitcoin. Whenever you see the price touching the support or resistance zone, it does not always mean there is a reversal; you also have to find a few more confluences to make the trading signal valid. These confluences can be a candlestick pattern or even indicator as some traders prefer using.
Trading bullish reversal
You will be using multi time frame analysis for trading both bullish and bearish reversal using double top and bottom. A bullish reversal is when the price moves in a downtrend and then reverses in the opposite direction and makes it an upward movement. You will be using a higher time frame for the trend, say 4H, followed by 1hr for patterns and 30min for trade execution.
Moving forward, you will draw your support zone and wait for the price to touch and reject the support zone for the second time. If it does, you will move to the lower time frame for the trading setup.
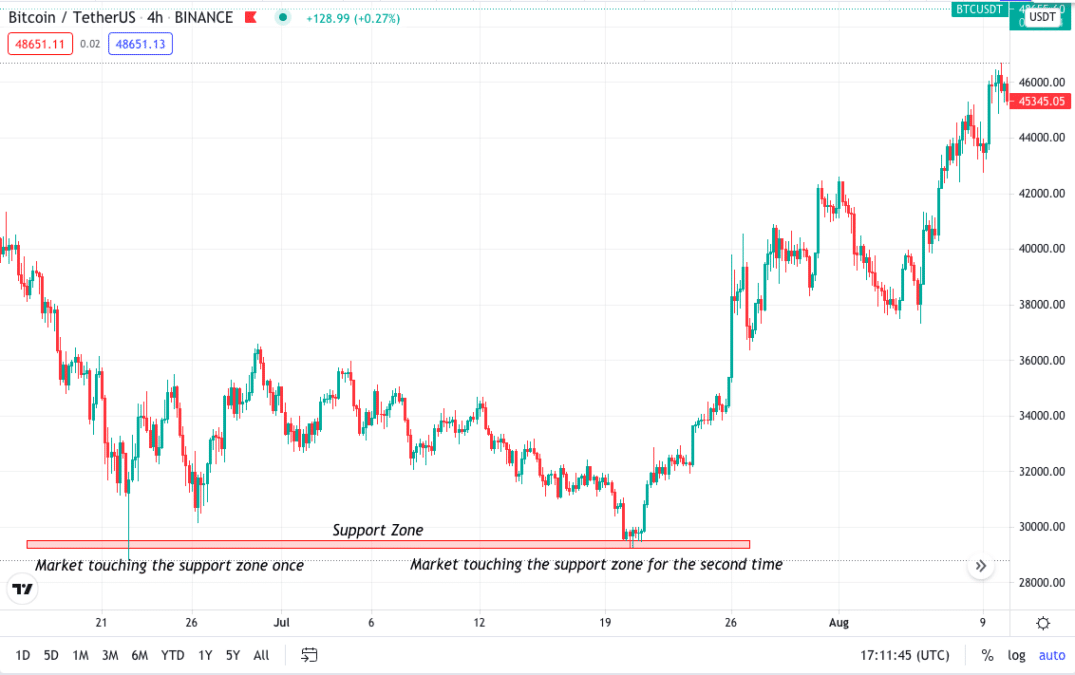
For better understanding, In the below BTC/USDT 4H time frame, you can see the price was moving downwards, touched the support zone once, went up, and then again touched it for the second time.
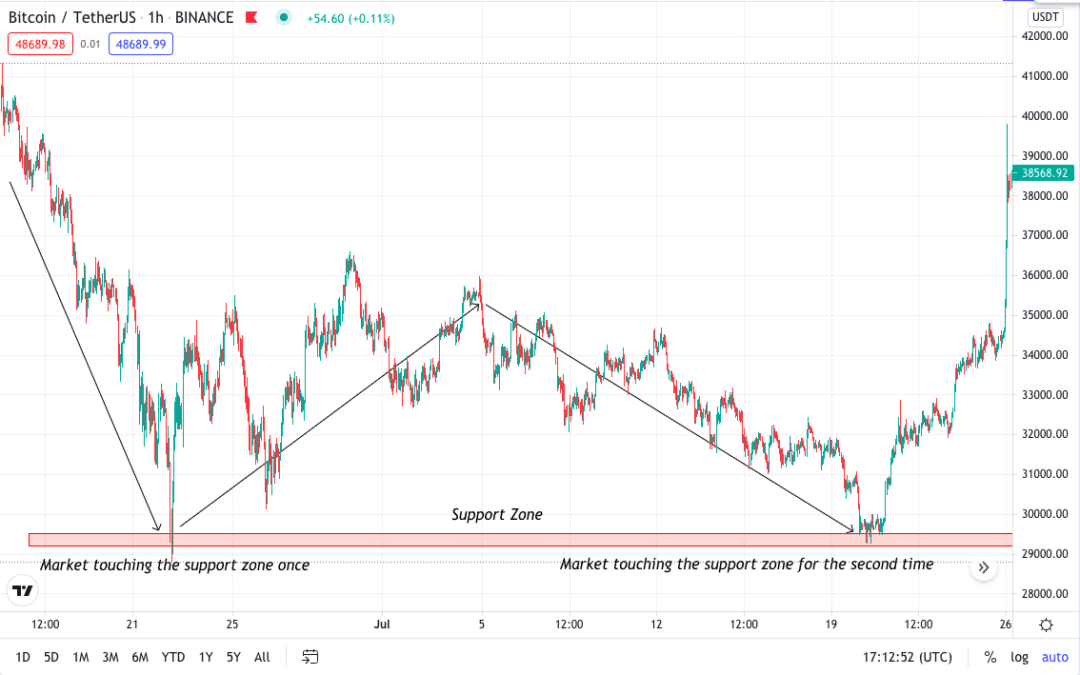
Moving to the lower time frame of 1H, the price movement could not break the new high. Also, you can see the second time when the price touched the support zone; there was multiple candle formation showing the market is reacting to the support zone.
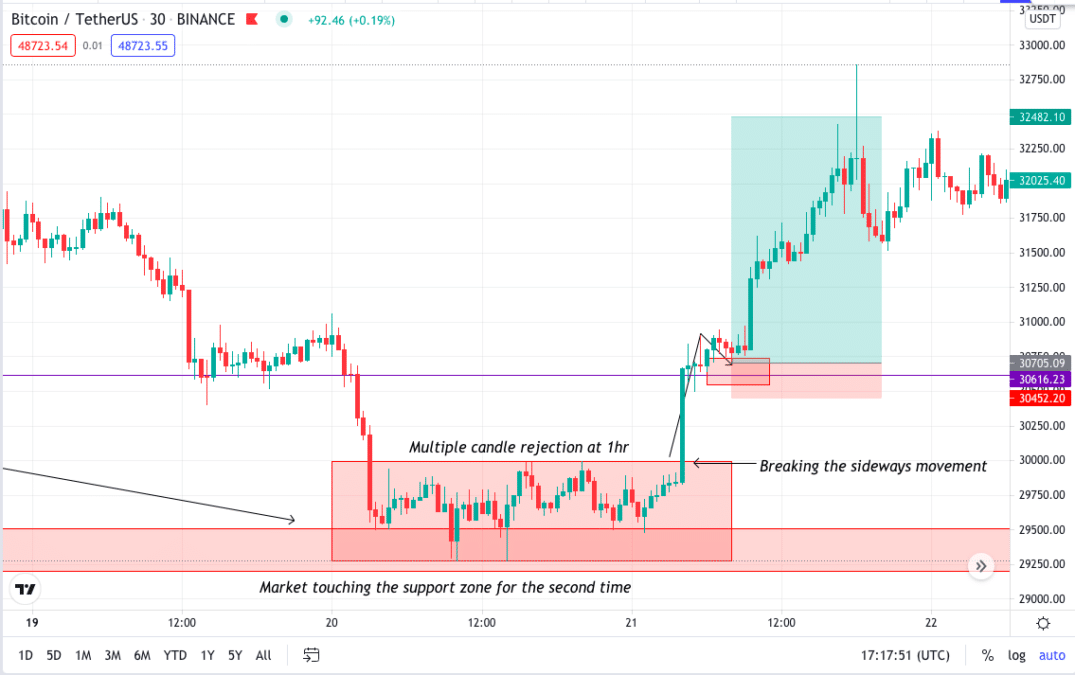
In the 30min time frame, you can see the price with multiple candle rejections, and it states that the price cannot go further as the buyer is taking the entry into the market. Here the buying signal is more evident as you see the price going into sideways movement. You will have to wait for this sideways movement to break above the structure for a signal to open the buying position.
Trading bearish reversal
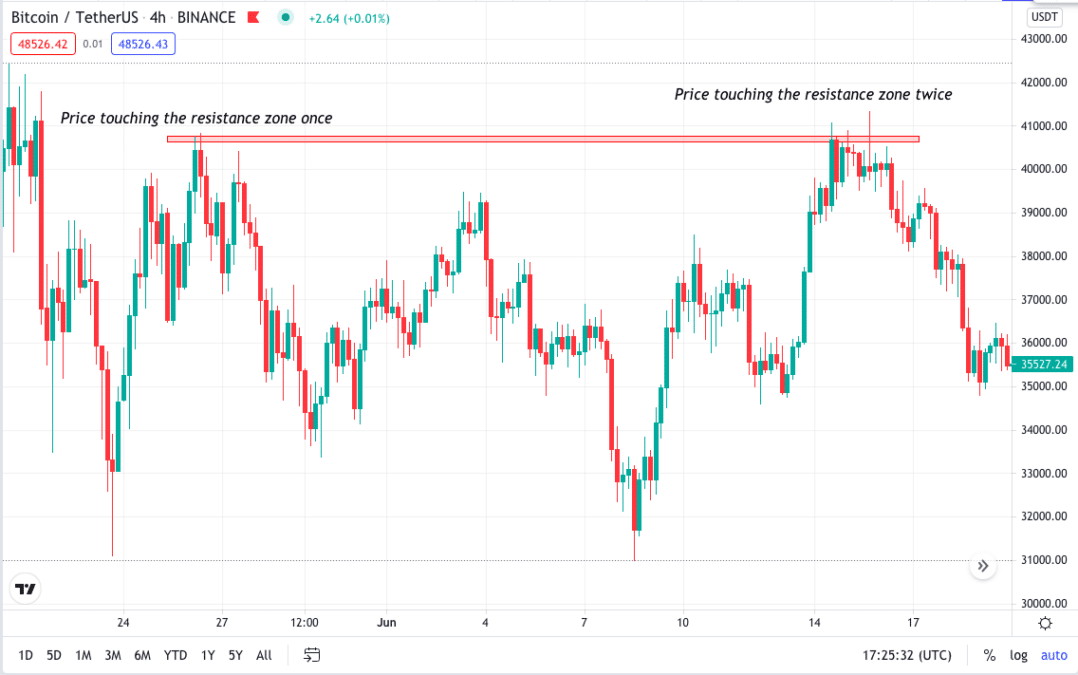
While trading bearish reversal, you will first draw your resistance zone and wait for the price to touch and reject the zone for the second time. If it does, you will move to the lower time frame for the trading setup.
In the below BTC/USDT 4H time frame, you can see the price moving upwards, touched the resistance zone once, went down, and then again touched it for the second time.
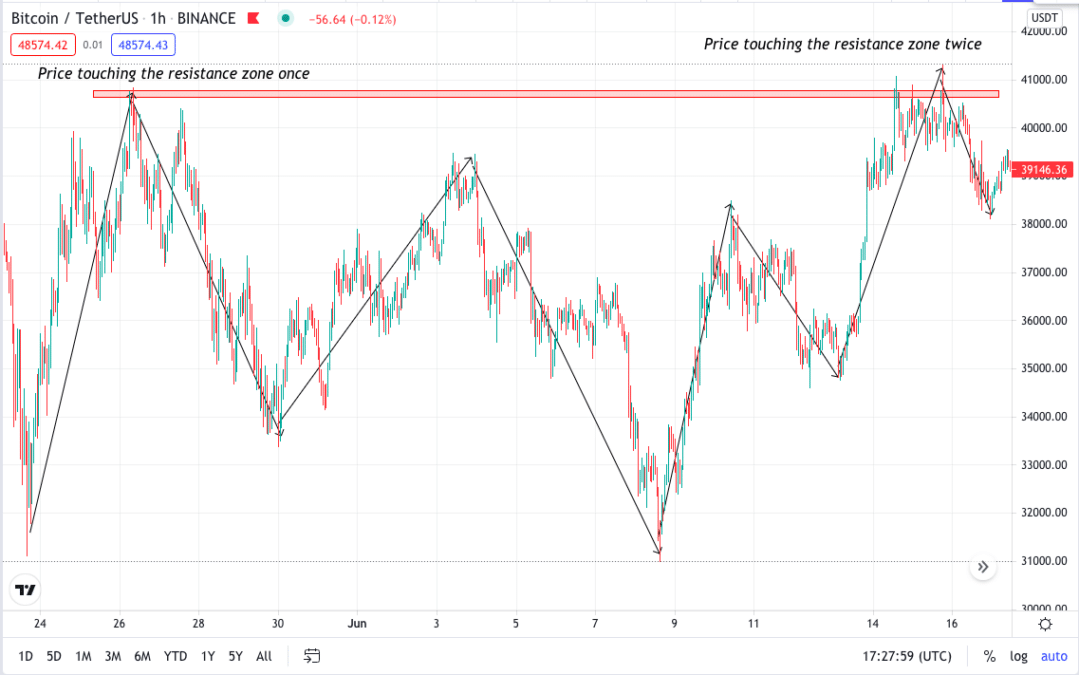
So moving to the lower time frame of 1H, the price movement could not break the new low. Also, you can see the second time when the price touched the resistance zone; multiple candle formations showed the market reacting to the zone.
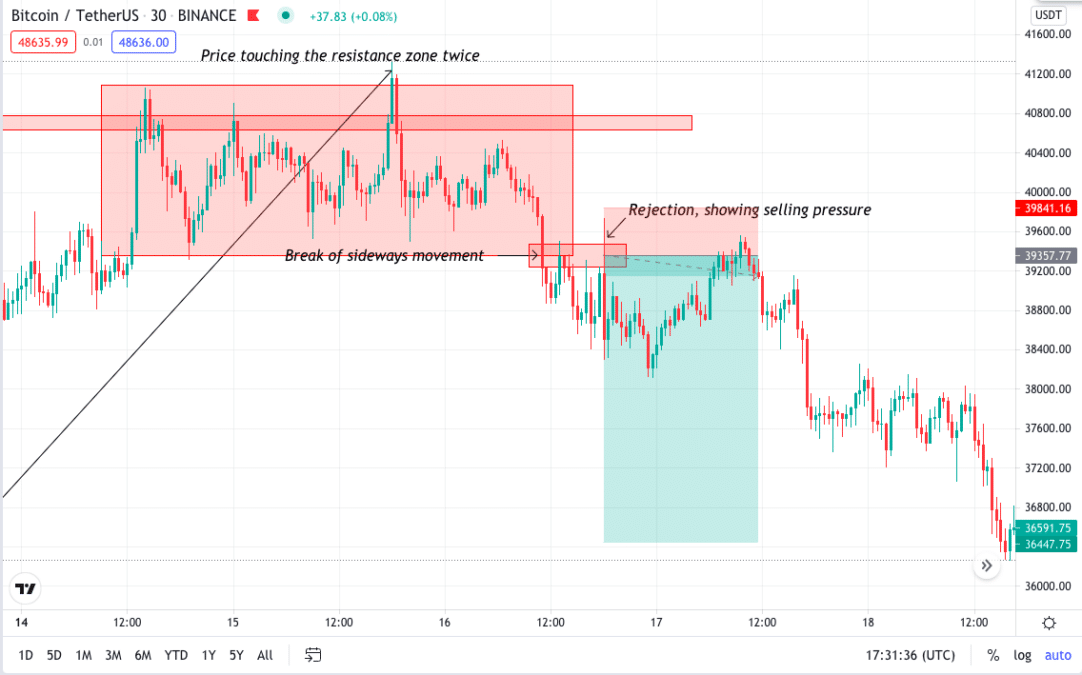
In the 30min time frame, you can see the price trying to move up but not successfully going through. Also, the price has entered the sideways movement, and there is no clear structure. Here you will wait for the price to break below. Once you see the price breaking the low, you can look for retracement or retest and take the selling position.
Final thoughts
Bitcoin is highly volatile and can lead to significant losses if not traded correctly. Double top and bottom is a potent strategy if found and traded with proper risk management. Always remember to trade any asset with appropriate confluence. Confluence will help you to add more accuracy to your trading setup.
If you know candlestick analysis, it will be an added advantage for you. Candlestick themselves are sufficient to tell you what the buyers and sellers are up to.
Try practicing this strategy; the more you do, the better you get.