- What is the pattern with the diamonds?
- Is a diamond pattern bullish or bearish?
- What is the most successful trading pattern?
The diamonds pattern appears on any chart once in a while. For this reason, not many traders are aware of its existence, much less trade the pattern. The pattern might be there on your charts, but you might have mistaken it for another one.
The diamonds formation is a member of the large family of classical price structures. The other members include head and shoulders (H&S), butterfly, wedge, pennant, triangles, and more. The diamond setup is not as popular as the other members because it rarely occurs on the charts.
Many market participants confuse the diamond formation with the more familiar H&S setup. Although the two patterns look the same, they have distinctive structures that make them different from each other. They call head and shoulders setups whose shoulders and neck digress from the standard as skewed. As a result, the diamond formation is not highlighted or discussed.
Let us learn how to identify this pattern on the charts and cover one way to trade it. We will compare this pattern with other standard figures to make the difference clearer and the pattern stand out.
What is the diamonds pattern?
There is a lot of misconception about the structure of the diamond formation. Some people regard any structure that looks like a diamond as a diamonds formation. Others inadvertently call head and shoulders formations diamonds patterns because they can draw seemingly diamond structures off of head and shoulders.
To avoid these misconceptions, we have to identify the pattern correctly. To do that, let us review two similar, more familiar structures. This will make you quickly recognize one pattern from the others. All these structures are reversal price patterns. The last two swings before the reversal make all the difference.
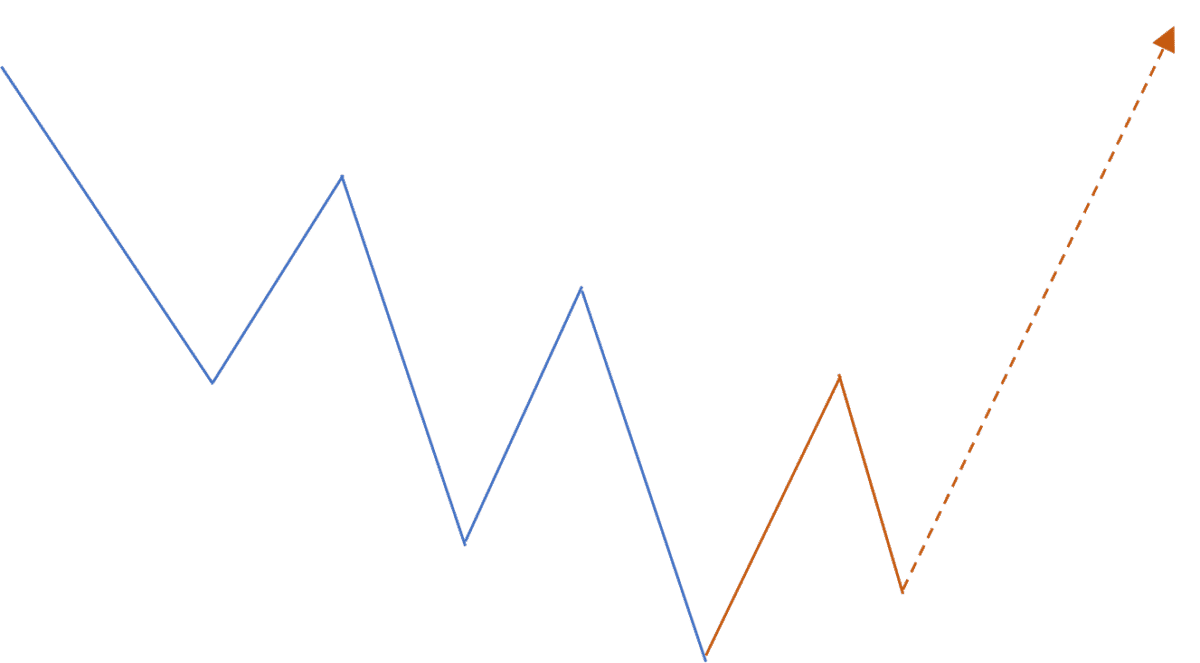
Dissecting the 123 structure
Below is the market structure for a bullish 123 formation, which forms at the end of a downtrend. We are looking at a bearish market in this example. The price makes a step-down ladder formation, which is a series of lower high and lower low. Before the reversal, the price did not break the previous lower high but instead prints a higher low and then explodes to the upside.
The last downswing before the upward reversal is the most critical. As long as that swing is at least 25 percent of the previous upswing, that is a valid swing. This downswing does not need to align at the same level as the penultimate lower low as long as it does not break the lowest low.
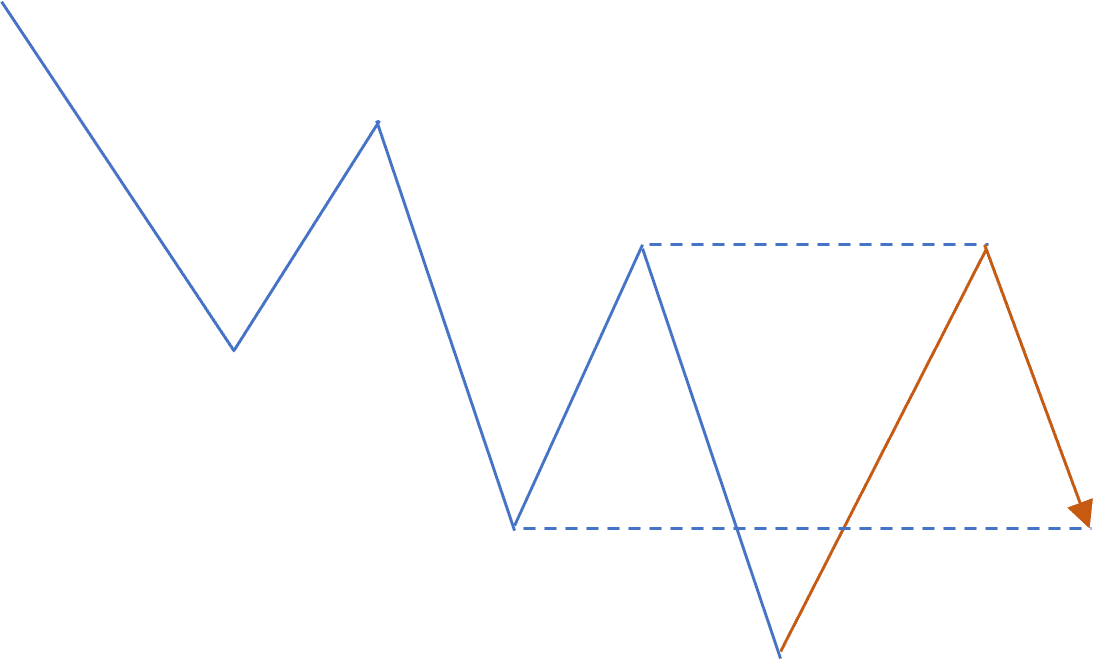
Dissecting the head and shoulders
Consider the head and shoulders in the image below. This pattern is different from the above 123 setup in two points. First, the penultimate swing (or the upswing) ends at the level of the previous lower high. It might go beyond or fall short for a few pips as long as the two swing points are essentially at the same level.
Second, the last swing (or the downswing) ends at or near the level of the penultimate lower low. That is why this pattern is more obvious than the previous pattern. You can easily anticipate the completion of the right shoulder after the price fixes the previous swing. For the 123 pattern, the last swing can end anywhere between the endpoint of the last upswing and the lowest low point.
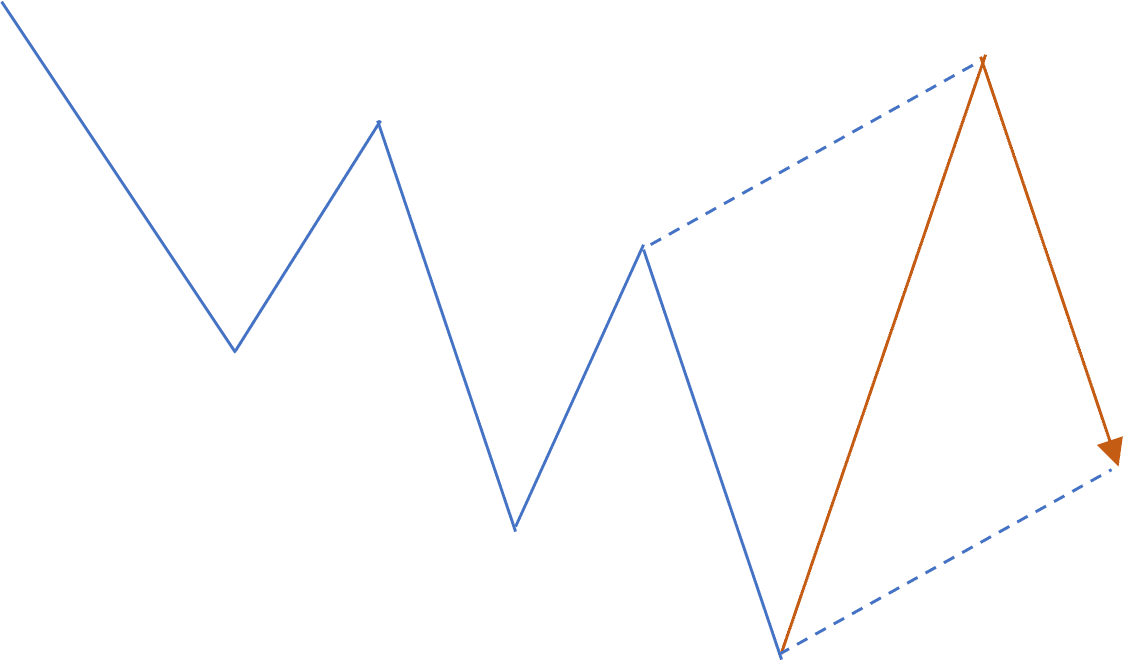
Dissecting the diamond structure
Below is the makeup of a bullish diamonds formation. What makes it different from the two previously covered patterns is breaking the last lower high by the penultimate swing. To determine the completion point of the diamond formation, connect a line from the last lower high to the endpoint of the penultimate swing. Then copy this line and put it at the lowest low point.
It is not necessary that price forms a perfect diamond shape, as you can see below. The price level of the completion point is more important. Your entry zone is the price range from the completion level to the lowest low. Then you can wait until the price approaches this completion point or level and find a reversal signal.
How to trade the diamonds pattern?
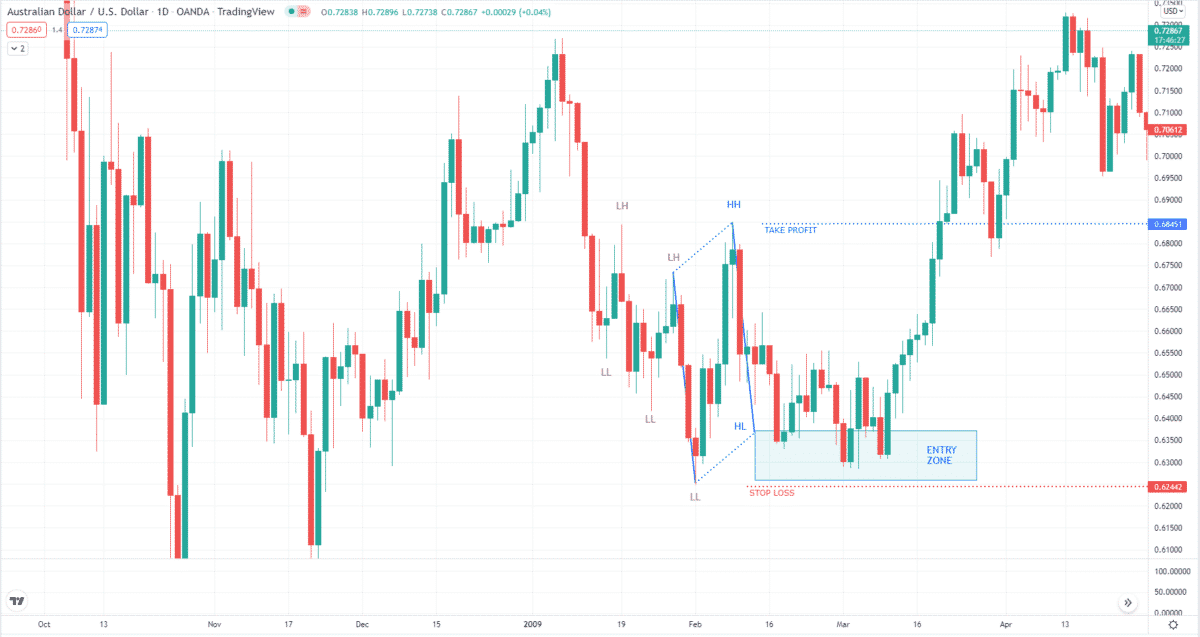
Now that you know how to identify the diamond formation, you are ready to trade it. For this purpose, we will use examples, one buy setup and one sell setup, to illustrate the concept. First, let us consider a buy setup. As you can see in the daily AUD/USD chart below, price is making a series of lower high and lower low, so we are looking for a buy diamond setup.
The setup is triggered when the price breaks the last lower high and registers a high. Then we can pinpoint the completion of the diamond setup. You can start looking for a buy entry when the price enters the entry zone. The setup is valid as long as the price does not break below the zone. Your stop loss goes below the zone’s low, and you can aim for the new high as the take profit target.
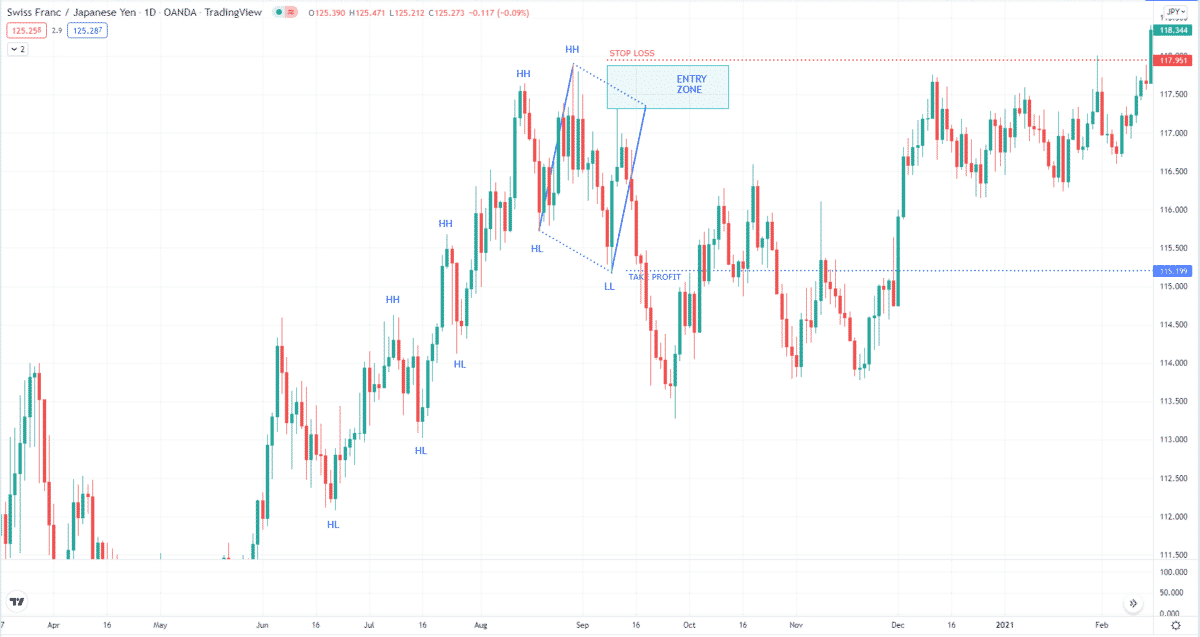
Now let us consider a bearish diamond setup. Refer to the image below. Here we see that price made a series of higher high and higher low before making a new low, breaking the bullish market structure. After this, you can pinpoint the likely completion of the diamond setup and then draw the entry zone.
This trade would have worked nicely had you taken the sell trade, which is rather challenging. Price barely touches the lower boundary of the zone and then sold off. Like the bullish setup, you can put the stop loss above the entry zone and the take profit at the new low.
Final thoughts
After reading this post, you should have known how to identify and trade the diamond formation. The setup is difficult to spot if you can differentiate it from a 123 and an H&S setup. The great thing about this trading tool is that the stop loss and take profit are built in the setup. You can expect the pattern’s completion, and you can start looking for entry. As discussed in this article, a winning trade should not take too long to hit the target.