- What is Ethereum?
- What is the supply and demand zone?
- How to trade ETH using these zones?
The crowd of traders, investors, and spectators of different financial domains are now having their eyeballs on the vast opportunities of crypto and blockchain. Well, you also might be one of them who wants to get into the shining and new promising industry.
You might be hearing about the famous Bitcoin and Ethereum crypto coins. Both are pretty renowned for real-life usage. Together, these two and some more excellent and promising coins have bought high volatility in the crypto space.
Investing and trading are two perspectives of gaining from a financial asset. While mainly investing is long term, trading is a technique to earn quick profit from the market. Let’s talk about Ethereum and how you can trade this volatile asset using a simple supply and demand zone.
What is a cryptocurrency?
It is highly secured by blockchain technology that uses cryptography to secure transactions.
The first crypto ever was Bitcoin, which came into existence in 2009. Back then, just like any other new industry, it did not get much attention, but after 2016 BTC was everywhere known as the king of high return investment.
The main reason for crypto booming and gaining much interest is its decentralized nature, immune to the government. After Bitcoin, Ethereum ranks second according to CoinMarketCap.
What is Ethereum?
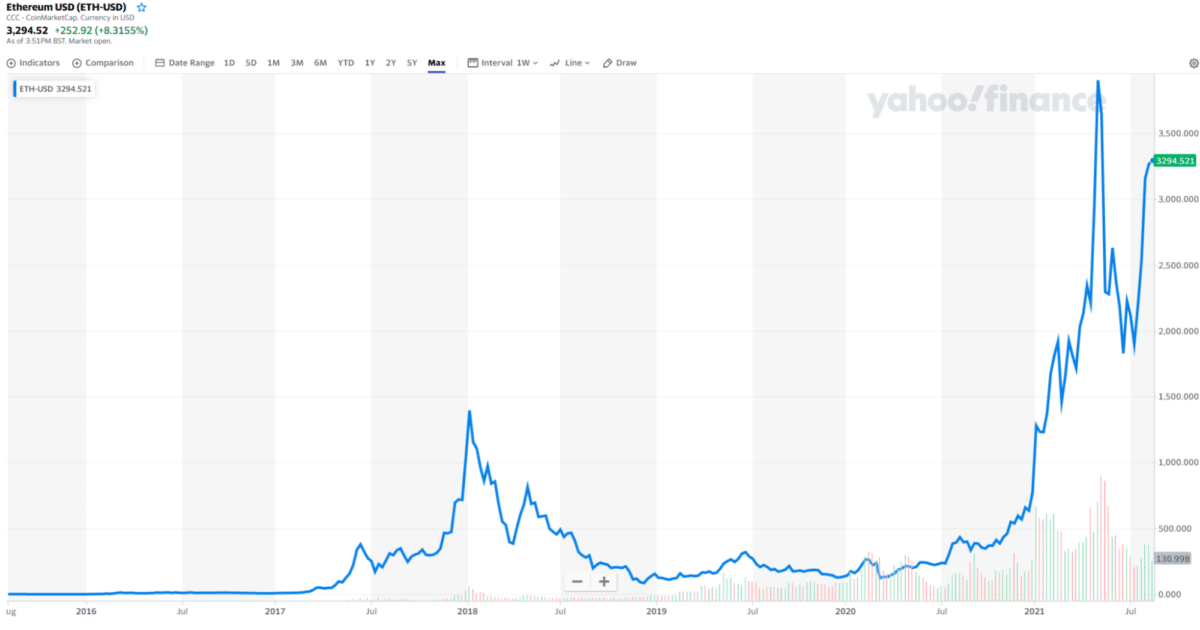
It is the second most traded digital currency in the crypto space after Bitcoin. Vitalik Buterin founded Ethereum blockchain, which was launched in 2015.
ETH is a decentralized open-source blockchain operation that gives a hand to almost all decentralized finance systems. The reason for this is because Ethereum aims to become a global platform for decentralized applications, allowing users from all over the globe to write and run software that is immune to restriction, downtime, and cheats.
Ethereum suddenly got famous after 2018 because of one reason that makes it different from any other blockchain, and this is the adaptation of smart contracts on ETH. Ethereum blockchain is the first one that has established the concept of a blockchain smart contract program.
Smart contracts are programmed to work automatically by executing the necessary actions to meet an agreement between diverse individuals in the digital world. It was designed to increase the trust and transparency between the parties by reducing transaction costs and increasing transaction reliability.
A coin of Ethereum blockchain is at number two according to CoinMarketCap, with a circulating supply of 117,165,717 ETH coins.
What is the supply and demand zone?
In economics, it is the primary reason for any financial asset price fluctuation, such as gold, index, or even crypto. Not even this supply and demand works in our day-to-day life as well; you do not have to be in the finance industry to encounter it.
Generally speaking, when the demand for an asset decreases, the price decreases, while if the demand for an asset increases, the price increases. This rule is for every industry, even for crypto.
In any form of trading, we technically call supply and demand as support and resistance. You can use these zones and trade any financial market, including crypto, in this case, ETH.
How to trade ETH using the supply and demand zone?
Let’s learn a simple yet powerful strategy to trade ETH.
Like every other financial asset, ETH also has three movement directions:
- Uptrend
- Downtrend
- Sideways
The first step is to select the ETH/USDT chart and move to a 4H time frame to analyze the overall trend. In the 4H time frame, you will have to figure out if the price is making a higher high and higher low or lower high and lower low. By that means, you will know if the market is moving up or down.
If the price moves sideways, say not breaking the high or the low, then do not enter the trade. In that case, you need to wait for the breakout or breakdown for a better risk: reward and safe trading setup.
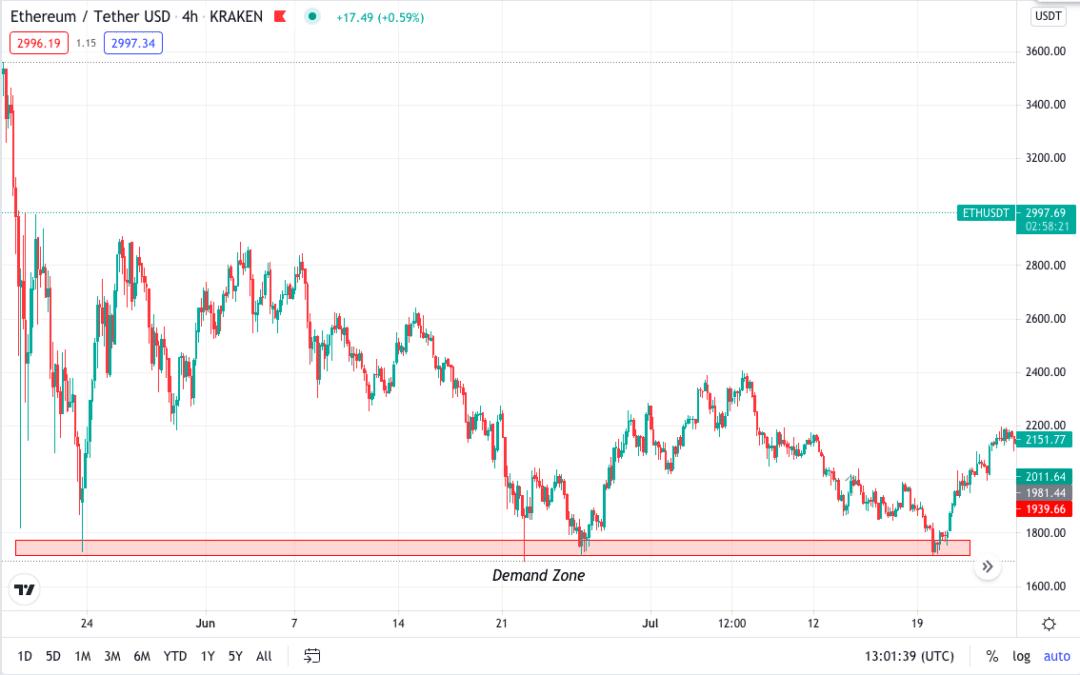
Once you analyze the trend, you will put your supply and demand zone or support and resistance zone. On the chart below, the area where you see the price coming down will be your supply zone, while the area where the price will move up is your demand.
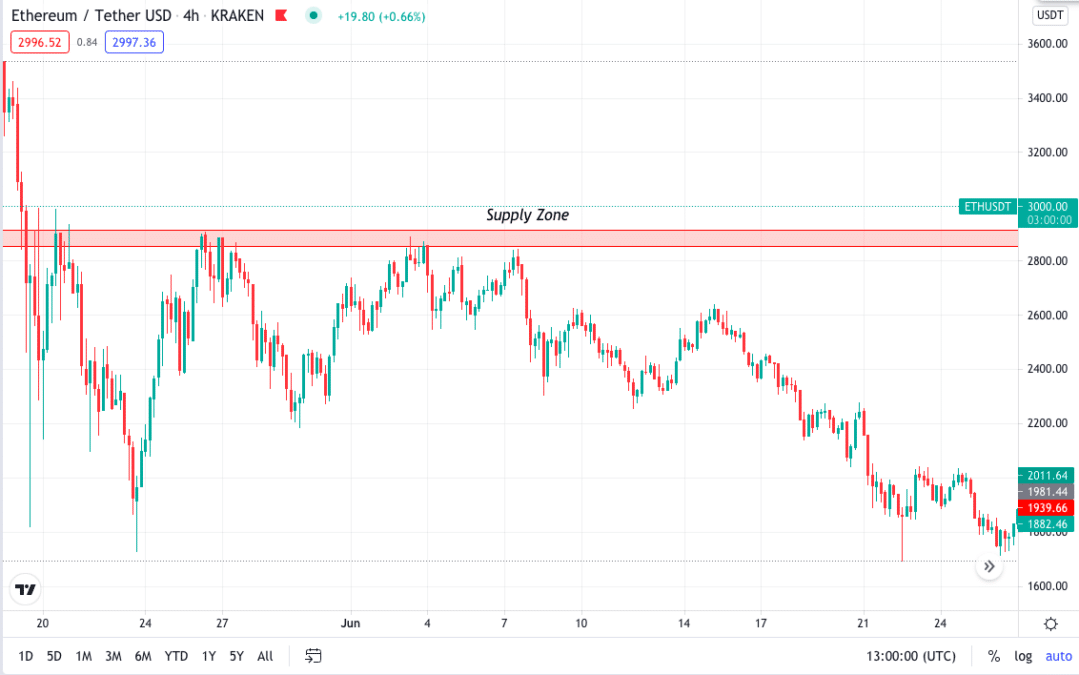
In the supply and demand chart, you can see how the price of ETH reversed after touching these zones. This is just a probability and not an actual trade. You will need to jump into the lower time frame for rejection from the zones and trade setups for more confirmation.
To take the trade, you will move into a 30M time frame. The reason to do so is that you will have to see the candlestick patterns and high and low price breaks. Once you are in the 1H time frame, you have to wait for the price to come near the supply or the demand zone.
- If the price comes near a supply zone, that means you will be looking for a sell trade setup.
- If the price is moving near the demand zone, you will look for a buy trade setup.
Moving forward, you will notice the price forming either higher high, higher low, or lower high, lower low. If you see the price movement like this, then you will wait for the breakout or breakdown. For a much better explanation, we have an ETH/USDT chart below.
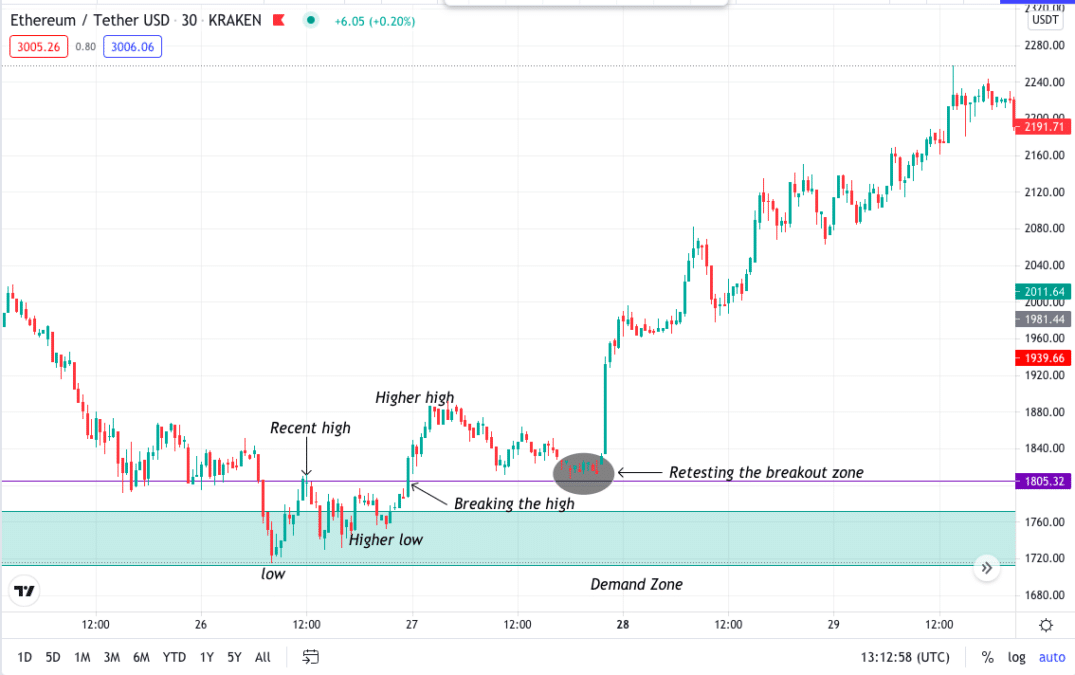
In the example, you can see the price was near a demand zone, meaning you will look for buy trading setups. Moving to the 30M time frame, you can notice the price is moving down and then touches the demand zone, and you can also see the price making a new high and then a lower low.
Now clearly, you can see the price breaking the previous high. This break was a good buying opportunity, but you could wait for the retest if you have a good risk: reward ratio.
When the next time the price comes down again, you can see a lot of small red candles showing the selling pressure is weak, and buyers are entering the market. All these scenarios give you an accurate buying trading setup.
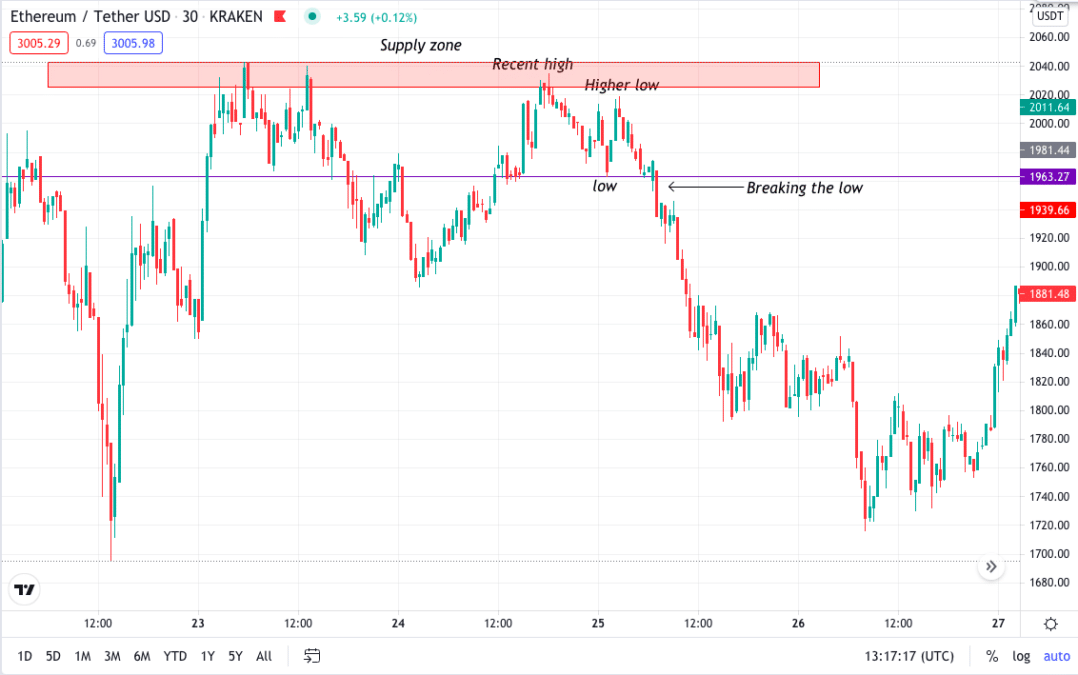
In the below example, you can see the price was near a supply zone, meaning you will look for selling setups. Moving to the 30M time frame, you can notice the price making a new low and then a lower high now. You can see the price breaking the previous low. This break was a good selling opportunity.
Final thoughts
Ethereum is a very volatile crypto asset to trade. Before investing or trading any financial asset, you must know about it. This supply and demand strategy is simple and easy to deal with, but you must not always jump into the trade based on it.
It is always better to have more confirmations before taking any trade. Candlestick analysis is essential while trading price action. You may also use indicators to trade ETH, but as most of the indicators lag, it won’t always give you a trading signal at the right time.
It is always better to follow a good risk management strategy.