- What is Triple top figure?
- Is a Triple top bullish or bearish?
- How do you trade this pattern?
The Triple top is a classical pattern that often appears at the end of an uptrend and signals a trend reversal. Failing to break a resistance level for three times, the price creates a Triple top, suggesting that buyers are losing steam and sellers are taking over.
You can find this pattern in any time frame. However, a valid Triple top requires an initial uptrend. Due to the apparent tug of war between buyers and sellers, it takes time for the pattern to complete. If you go down to lower time frames, you might often find this setup there.
Let’s learn how to identify this figure as it forms on your chart, know the elements, and find out how to enter the trade through an example.
Understanding the Triple top
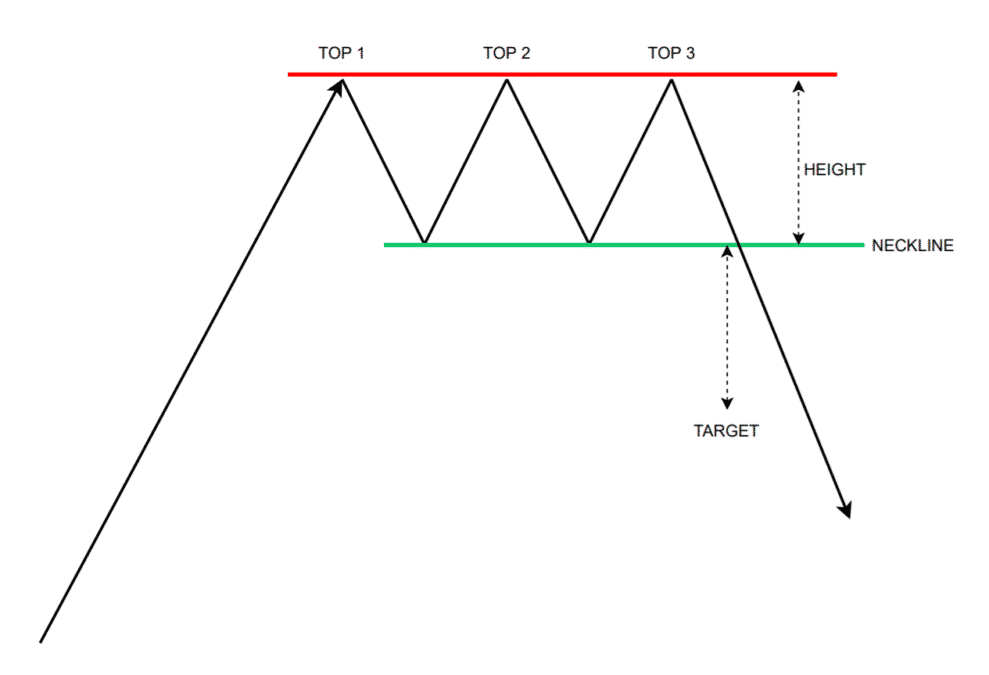
A Triple top is a bearish reversal pattern. Considering a high win rate of 77.59 percent, it is a very reliable trading setup. Plus, you can easily spot it on your charts because of its structure. The most apparent attribute of the setup is three peaks forming at almost the same level. This level is a strong resistance as the price fails to continue its upward movement after three attempts.
The pattern forms in this manner. Price had an extended uptrend and started feeling a selling pressure. Then it registers a high followed by a rotation lower. The price tests the new high again to break it, but it fails. It makes a final resistance test, which is met again by a lot of selling pressure. This tug of war creates resistance and neckline, as you can see below.

The price can go beyond resistance or fall short from it marginally. The peaks are marked with decreasing volume in stock trading, but this is not necessary for currency trading. What is essential is that the three peaks are essentially at the same level.
Three main elements of the Triple top:
- Uptrend
The market must be going up prior to the Triple top. It could form a step-up ladder formation or a straight line.
- Resistance
A price level or zone where a breakout attempt is continuously rejected.
- Neckline
A minor support level or area that the price uses as a jumping board to try and break resistance. A breakdown of the neckline signals the reversal.
How to trade the Triple top pattern?
If you are familiar with the Double top pattern, you can trade the Triple top setup in the same way. As you might have expected, the Triple top is more reliable than the Double top by 2.58 percent, according to samuraitradingacademy.com. Because the Вouble top is a practical setup, you can hardly see Triple top formations on the higher time frames.
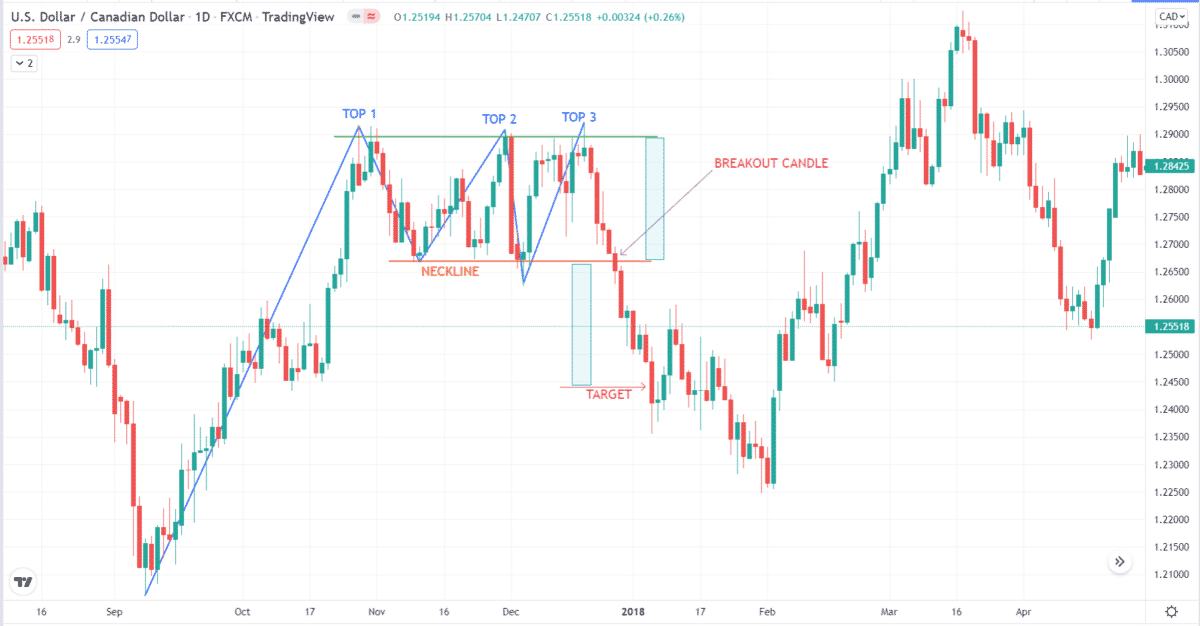
Let us take an example to illustrate how to trade this setup. Refer to the daily chart of USD/CAD in the image below. As you can see, this scenario fulfills all the requirements of a valid setup.
- First, we have a long initial uptrend.
- Second, the price hits resistance and fails to break above it.
- Third, a neckline forms after two failures.

Once the third top has formed, please wait for the price to get down to the neckline and break it down. Since the neckline is a support level, you can expect a reaction the moment the price touches it. This case is different. Price immediately breaks through the neckline on the first attempt. Once you see a breakout candle, you are ready to enter a sell trade.
Open a sell trade right after the breakout candle closes. Setting the take profit is easy. Just measure the range from the resistance to the neckline. Copy this rectangle and put it below the neckline. Your target is the price at the same level as the lower boundary of the rectangle. Setting the stop loss is challenging because you cannot see a swing high close to the entry.
If you put the stop loss on the third top, your stop loss will be large, and you will get a reward-risk ratio of only one. If you want to get a ratio of two, just put the stop loss in the middle of the range. As you can see, it takes just six candles, or a little more than one trading week, for the price to reach the target.
Alternative sell entry
The entry method covered in the previous section is the standard approach. With this approach, you will not miss any trade. The downside is that you cannot get a high reward-risk ratio. An alternative entry method is a break-and-retest strategy. You can allow price to leave the breakout point convincingly if it has not hit the target yet. When the target is already reached, you miss the boat.
You can get a better reward-risk ratio by putting a sell limit around the breakout point. Then set your stop loss at the middle of the range. A sell limit will provide you with a higher ratio than a market sell order. The drawback is the possibility of missing trades because the price has gone on to reach the target without looking back.
Final thoughts
Trading the Triple top is very similar to trading the double top. Because the Triple top appears less often, this downside is compensated by a higher win rate. Coupled with a good reward-risk ratio, the Triple top can be your ticket to becoming profitable. Review your charts and see how it works in the past. Then apply the knowledge in a demo account and then later in real trading.