- How to determine the trend?
- What is the most profitable trading strategy in FX?
- What are the pros and cons of a 4-hour trend strategy?
Choosing the perfect time frame is a crucial factor in building potentially profitable trading strategies. The 4-hours chart is viral among traders as each session lasts for eight hours approximately in the FX market. From the beginners to the institutional traders, all check on, especially day traders, seek their trade setups using 4-hour charts.
However, it requires such skills to identify and implement proper trading strategies using 4-hours chars. Understanding trader’s sentiments and approaches in the marketplace with appropriate strategies will lead you toward a successful trading career.
Let’s have a look at all essential information to identify trends and trading strategies using 4-hours charts.
What is a forex four hours trading strategy?
All traders use some specific time frame charts to analyze the price movement. Strategies to approach the marketplace that involve using a 4-hours chart are FX four-hour trading strategies, which allow market participants to hold on to positions for days, even weeks. Additionally, you can frequently find common chart patterns and more trade setups compared to daily and weekly charts.
Why do we need to have a trend for a 4-hour trading strategy?
Identifying trends enables opportunities to catch the most profitable trading positions besides riding on the trend in the 4-hours charts. The skill of identifying trends reduces risk on trading capital. Moreover, it will increase profitability and help to improve making appropriate trade decisions in time. Knowing how to identify trends will be better because it will guide you when and how to enter or exit from trades.
How to determine the trend?
Trades use several methods to identify trends in the financial market. You can use trend lines or indicators such as moving averages, relative trading strength (RSI), moving average convergence divergence (MACD), etc.
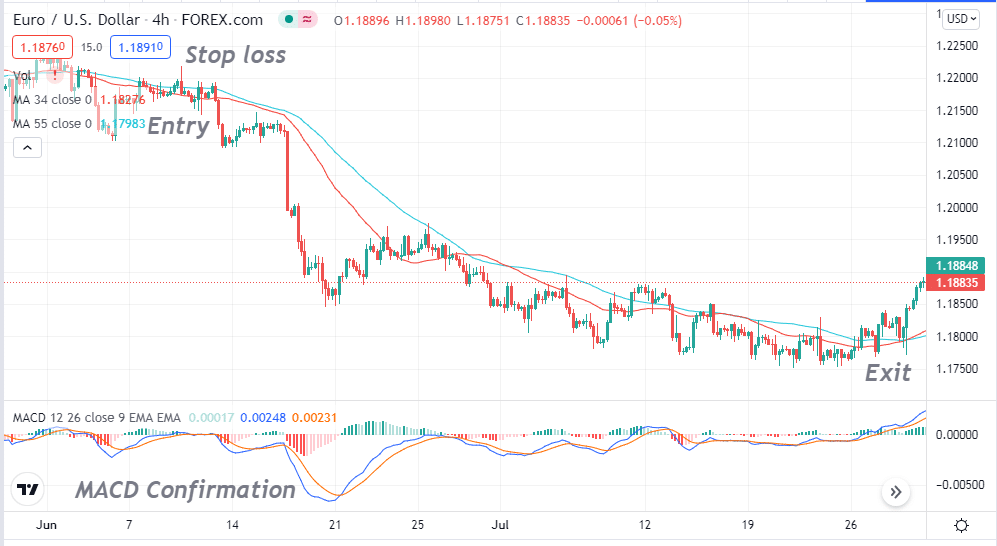
For example, we will use two moving average signal lines to identify trends in four-hour charts. We find in our study that applying MA 34 and MA 55 will give fantastic results to recognize trends in four-hour charts.
- The blue signal line declares 55 MA.
- The red signal line displays 34 MA in the figure below.
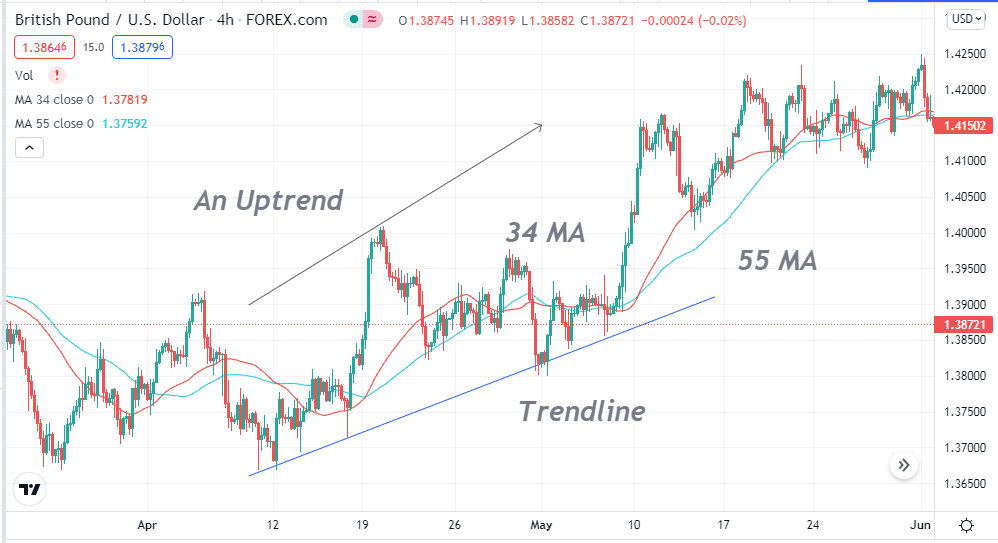
When the red signal line crosses above the blue signal line, that is an uptrend. On the other hand, when the red signal line crosses below the blue signal line, that indicates a beginning of a downtrend price movement.
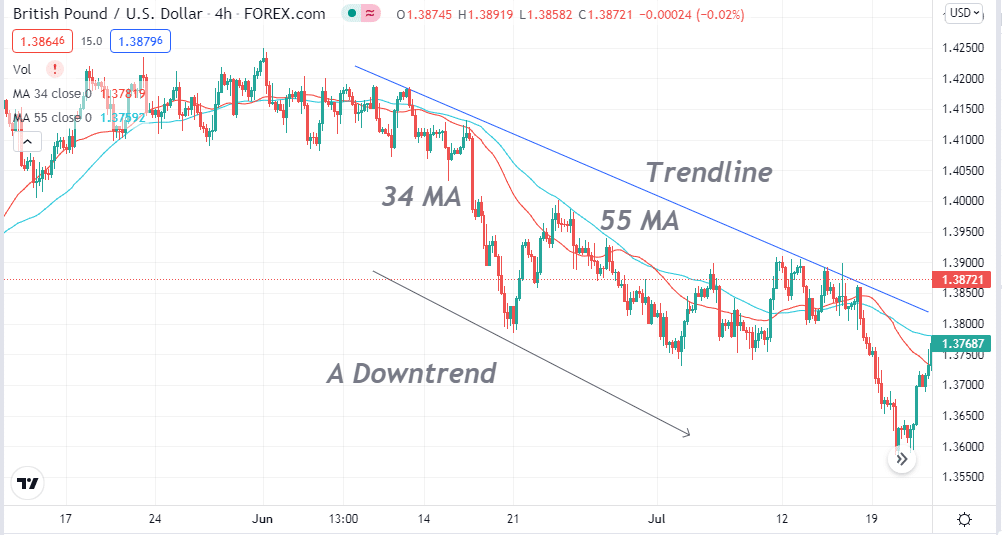
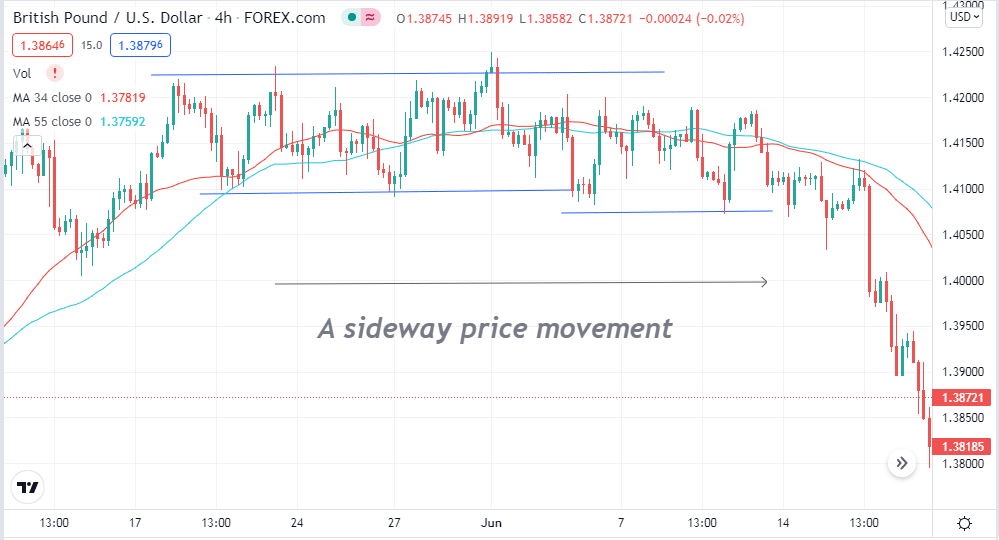
It is prevalent that the MA crossover occurs in support-resistance areas. You can also use the crossovers as support resistance zones, where price changes directions or takes breaks before continuing the current trend. These two signal lines continue to move in the upside while the price movement remains on an uptrend. Meanwhile, in a continuous downtrend, both signal lines continue to move toward the downside. When these two signal lines stay together for a while, it may be a sideways price movement.
Bullish trading strategy
Now we know the MA crossover technique to identify trends in the four-hour charts. Now we show you strategies to identify profitable trading positions and complete trade setups. We use another popular indicator, the MACD, in these strategies besides MA crossover.
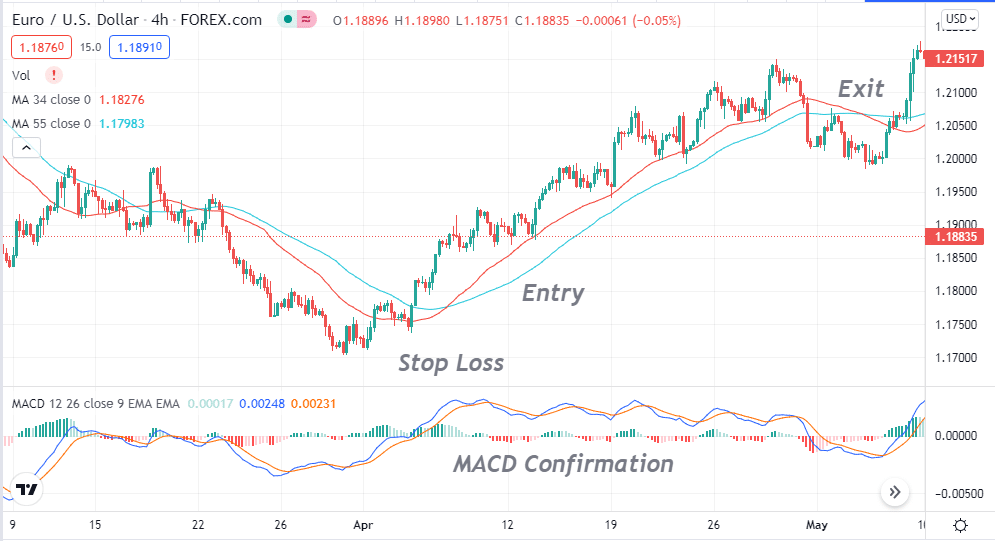
- When the red signal line or 34 MA crosses above the 55 MA or blue signal line, check the MACD window for confirmation.
- Check the signal lines of the MACD window that remains above the middle (0.0) line.
- Again check on the signal bars of the independent MACD window.
- If signal bars appear above the middle line, it is a suitable level to place buy orders.
- Wait until the current candle closes, then place a buy order.
- Put an initial stop loss below the recent swing low with a 10-15 pips buffer.
You can shift the stop loss at the breakeven point to reduce risk after the price candle makes a new swing high. You can hold the buy position till candles remain above the 34 MA or the red signal line. Close the buy position when the red signal line or 34 MA crosses below the blue signal line or 55 MA.
Bearish trading strategy
You will also find bearish trade setups on your charts often by using this strategy. Bearish trade setups are just the opposite of bullish trade setups. We already know how to identify bearish trends using MA crossovers. When the MA 34 or red signal line crosses below the MA 55 or blue signal line, then the price movement may start a downtrend.
- For confirmation, check on the MACD indicator window.
- Check if the signal lines remain below the middle line of the MACD indicator window, confirming seller domination on the asset price.
- You have to check on the MACD signal bars for more confirmation.
- If the signal bars start to appear below the middle line, the strategy allows you to sell orders here.
- Wait until the current candle closes, then place a sell order.
- Initial stop loss will be above the recent swing high with 10-15pips buffer.
That sell position is safe until price candles remain below the 34 MA or red signal line. You can shift your stop loss at the breakeven to reduce loss after price candles make a new swing low. Close the sell position when the MA signal lines start to stay together, or the red MA line crosses above the blue MA line.
Pros and cons of forex four-hour trading strategy
No trading strategy in the world of FX trading will guarantee you a hundred percent working. So these four-hour trading strategies also have some limitations alongside advantages. In this part, we will list the pros and cons of the FX four-hour trading strategy.
Pros
- You will get more potential trade setups in comparison to the daily or weekly charts.
- You can trade beside any other full-time job.
- You can catch trade setups faster than traders who use daily or weekly time frames.
Cons
- Smaller returns in comparison to the higher time frame trades.
- More trading positions means more trading cost.
- Risk insolvency in trading increases in days of economic events.
- You may often experience an accidental market shift.
Final thoughts
Finally, now you know the essential factors of the forex four-hour trading strategy. We suggest practicing the strategy in a demo account and sufficient backtesting before applying any strategy on your real trading account. Be careful to trade with four-hour trading strategies during significant economic event days.