- What is price action trading?
- What are the five tips for trading like a pro?
- What are the pros and cons of price action trading?
In forex trading, there are numerous strategies and methodologies that traders prefer to use. Each one has its way of analyzing charts and executing trades.
Price action, also known as naked trading, can trade in currencies and indices, commodities, or any other financial asset. Let’s learn using price action trading through these tips, which help you trade FX like a pro.
No one can constantly, accurately, and reliably predict how much this or that asset will cost in the future since fluctuations are determined by many criteria that must be considered on a global scale. Some of the reasons are random; therefore, traders in the FX market “trade probabilities” conclude deals on the probability of price movement in one direction or another.
For example, it is impossible to calculate in advance the time, place, and scale of a natural disaster, the nature of future political decisions, the results of negotiations between large economic actors. However, it is quite possible to classify the causes and determine the role, influence, and nature of each group of factors in the aggregate. And also, after analyzing the past movement of the FX market, make some assumptions about the future development of the trend.
What is price action trading?
It is a trading methodology that market participants use to analyze an asset’s price movement over time.
Traders who use this method firmly believe in following the way the price moves and its subsequent structure. From this, they can recognize specific patterns and predict the direction of an asset’s price.
Price action traders rarely use technical indicators since they analyze the chart in its ‘naked’ form. Meaning it is usually only the candlesticks on the chart. These traders use fewer or no indicators, and they believe it makes the graph look busy and can confuse or distract their analysis.
There are numerous things to consider when analyzing this trading tool. However, we have put together tips that will be valuable to your success.
Five price action tips
1. Trade the trend
Analyzing the trend to find good entries is a prolific way to trade FX. In price action strategy, analyzing the trending is done by identifying the highs and lows of the price.
- In an uptrend, you will need to check if the price is making higher highs and higher lows.
- In the downtrend, you will check for the price to make lower highs and lower lows.
These are critical areas of price movement. We will illustrate this in the chart below.
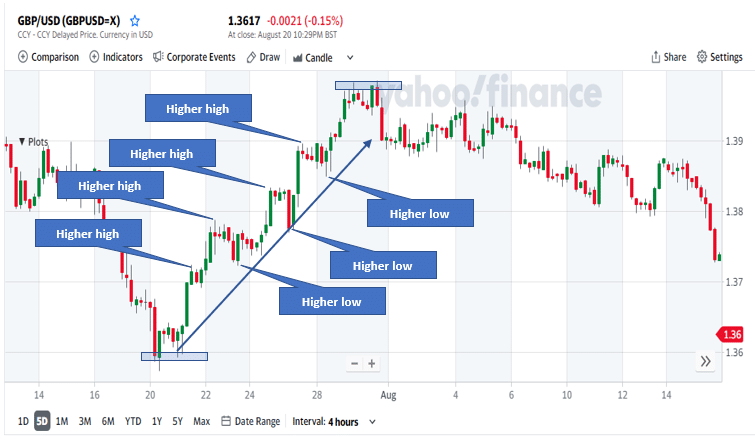
In this GBP/USD price chart, we can see the price is moving on an uptrend. As the price moves, it retraces back to form a higher low. It then moves up and creates a higher price (higher high) until it reaches the resistance level and reverses direction downwards.
If you were to buy this pair, you could buy during the uptrend, but you need to wait until a higher low since you would want to buy low to gain the maximum pips.
2. Take advantage of the momentum
Momentum is the speed at which the price is moving in a specific direction. Numerous indicators can help you identify momentum in price; however, it will be beneficial if you rely solely on price action techniques to determine momentum.
You can use the size of the candlestick bodies to identify momentum, the number of bullish and bearish candles, and the size of the wicks relative to the body.
Candlesticks with long bodies and small or no wicks show strong momentum. If the price is moving in an uptrend, and there are more bullish candles than bearish, it also indicates that the speed is high. Shorter candlesticks with long wicks are a sign of less momentum; in addition, it shows no direction in the market, a sign of indecisiveness.
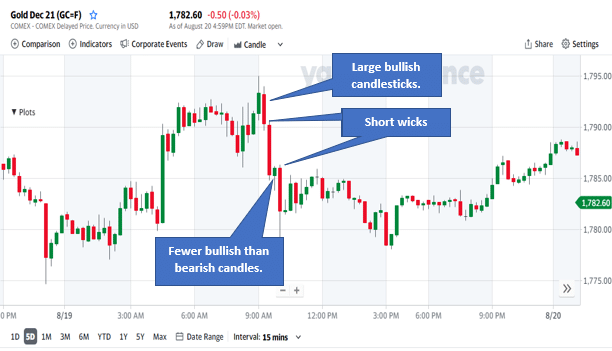
In this gold price chart, we can see the price is in a sharp downtrend. The large red candlesticks indicate strong momentum. Furthermore, the wicks are relatively smaller in comparison to the bodies. And there are more bearish candles than bullish ones.
3. Understand support and resistance
Identifying S&R zones is essential when looking for areas of trend change or breakouts. We can see from the chart below how the price cannot break certain critical support or resistance levels. You can use this to implement a strategy to predict future price movements by applying low risk.
In addition, previous strong resistance levels became supported later. A note here is to keep your charts clean and not too busy so that you focus on the significant zones only as the price is likely to break out from there.
Support and resistance do not mean that the price will constantly change its direction; it can continue in the same trend for a while. But it is essential to identify these zones so that you can spot potential entry points more accurately.
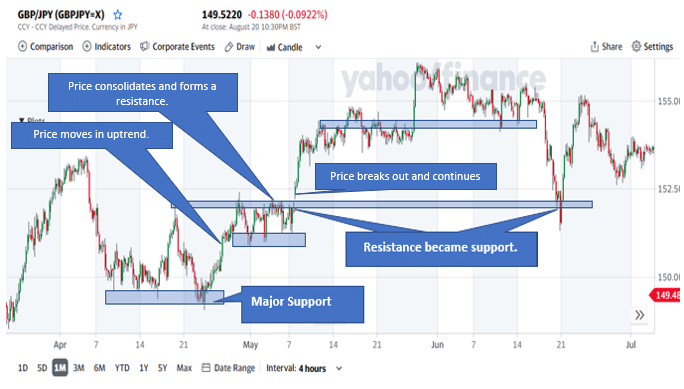
In this GBP/JPY chart, we have marked the significant support and resistance zones. You can see that sometimes the resistance zone is broken, and the price continues upward. The same resistance zone later becomes a support level for the price.
4. Look for patterns
Spotting price rejections brings all these strategies together. You can use rejection to confirm your analysis. In a momentum trend, once the movement slows down, you will start seeing shorter candle bodies and rejections of the price at a certain level.
The same with support and resistance, the price will reject these levels multiple times before breaking into a new trend.
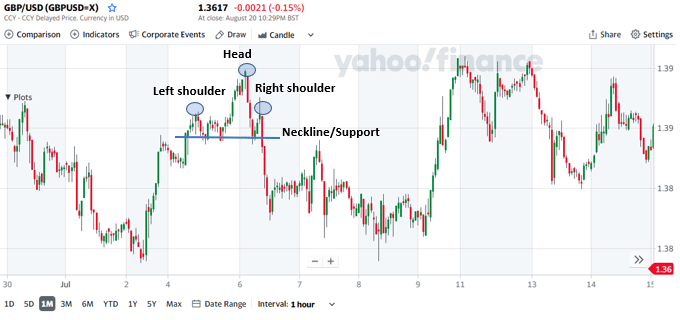
In this example of the GBP/USD price chart, we have identified a head and shoulders pattern after an uptrend. The left shoulder formed, and the price moved up to create the head. Then it rejected that level and moved down to the neckline/support and moved up to develop the right shoulder. After the right shoulder, the price broke out of the support and continued down.
5. Look for price rejections
Spotting price rejections brings all these strategies together. You can use rejection to confirm your analysis. In a momentum trend, once the movement slows down, you will start seeing shorter candle bodies and rejections of the price at a certain level.
The same with support and resistance, the price will reject these levels multiple times before breaking out into a new trend.
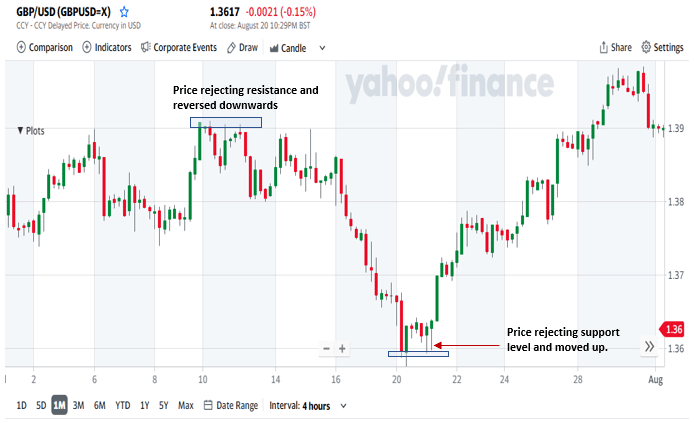
In the GBP/USD chart, we can see the price rejection from an uptrend to change direction down. The same for the support, the price rejected that zone numerous times after the long downtrend. It then broke out and moved upwards.
Pros and cons of price action
This trading tool has many benefits, but we should consider the downsides to this type of analysis.
Pros
- Less clutter on the chart
This trading type requires fewer indicators and lines on your chart. Therefore, the chart is less cluttered and not busy. It makes it easier to spot patterns and trends.
- Easier to spot entries and exits
With price action rules, you can find entries and exit points on the chart much easier than indicators.
- No fundamentals required
You don’t have to use fundamentals when trading price action, as your analysis is purely reliant on the market structure.
Cons
- Patterns are hard to spot
Initially, it is not easy to identify price patterns. It, therefore, takes a lot of practice to become competent in trading with patterns.
- It can be subjective
Trading price action is a very subjective view, and different traders can view the same chart differently. It can therefore be a daunting art for novice traders.
Final thoughts
Every trader has their preference when it comes to analyzing charts. Some enjoy using many indicators and are successful with their strategies; others combine price action and a few indicators. Whichever trading methodology you follow, you need to become the best at it.
Even among price action traders, there are subdivisions and different styles. Ultimately you have to stick to the style and analysis to your liking, and it will give you consistently good results.