- What is the most reliable FX pattern?
- How do you trade a flag pattern?
- Is it profitable to trade with this pattern?
Price movements in currency pairs follow some common patterns in different time frames. Identifying those patterns will enable opportunities to increase profitability in making trade decisions. The flag is a conventional pattern in financial asset price movements such as commodities, currencies, stocks, etc.
Another fact about a flag pattern is that the flag, weak pullback size, or retracement will not be more than 50% of the current trend. This pattern forms at the time of consolidation, which means when the price movement breaks the range, it may continue in the same direction as before.
Flag patterns can take place in many sizes, but it will pull back at least three periods. For example, the minimum pullback will be for three days in a daily chart, or in an hourly chart, the minimum pullback will be for three hours.
What is a forex flag pattern strategy?
These types of patterns are usually minor weak pullbacks on strong trending moves. Flag patterns occur at both bullish/bearish price movements, with bullish flags at bullish trends. Conversely, bearish flags appear at the bearish trends.
This pattern generates trade ideas toward the strong trend and suggests making trade positions when breakouts happen. There are usually large candles in the trend direction in comparison to the little candles of the flags.
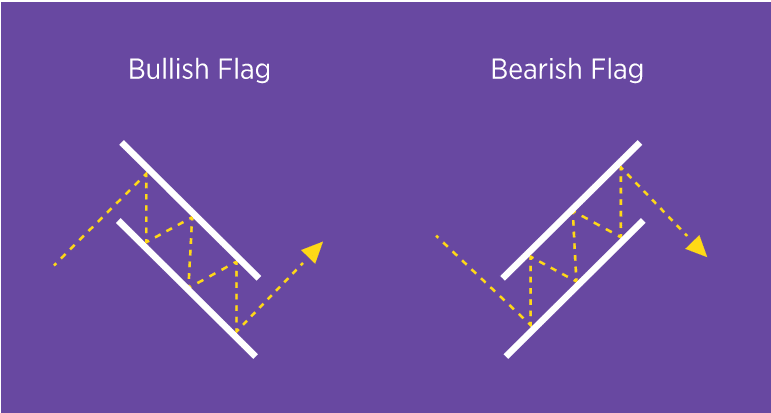
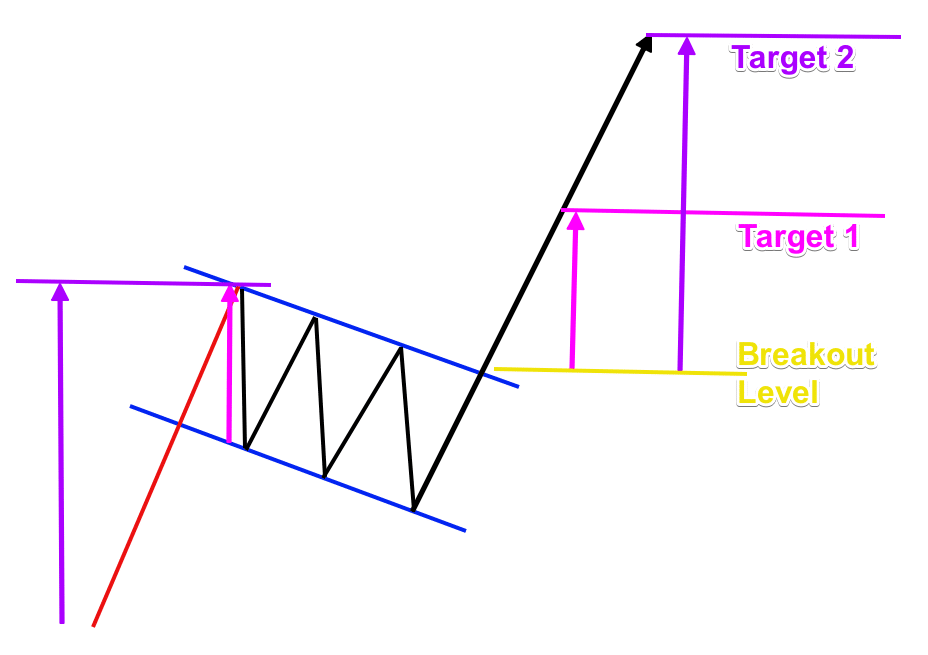
The best time to trade with a flag pattern is after the breakout occurs. First, the flagpole is the strong trendy movement, then the flag appears. The profit target will usually be the same as the pole size.
Another fact about a flag pattern is that the flag or the weak pullback size or the retracement will not be more than 50% of the actual trend. This pattern forms at the time of consolidation, which means when the price movement breaks the range, it may continue in the same direction as before.
Flag patterns can take place in many sizes, but they will pull back at least three periods. For example, the minimum pullback will be for three days in a daily chart, or in an hourly chart, the minimum pullback will be for three hours.
Why is the forex flag pattern strategy worth using?
Flag pattern often occurs at the price movement of several financial assets, which have sufficient volatility. Identifying this pattern will enable traders to make profitable and complete trading positions. The risk-reward ratio is high for flag pattern trade suggestions, as the flag pole is always longer than the flag.
However, this pattern won’t guarantee a hundred percent profitability every time. You need to confirm it by checking other factors before making trading positions.
A short-term strategy
We use the volume indicator beside the flag pattern in our short-term strategy to identify profitable trading positions. This method confirms strong trends from upper timeframe charts such as 4-hours or daily charts and seeks to identify potentially profitable trading positions at the hourly chart. We will find the flag pattern and then enter trading positions by the confirmation of the volume indicator. Volume indicator usually shows the trader’s participation at a specific time.
Bullish trade setup
When you want to make buy orders at any financial asset:
- Check the current trend from the daily chart to confirm it is bullish.
- Look for the flag on the hourly chart.
- Wait till the breakout occurs, and the price goes out from the flag range.
- For more confirmation, check the volume indicator; if there is any sign of increasing volume than the average, then it’s the right place to take buy orders.
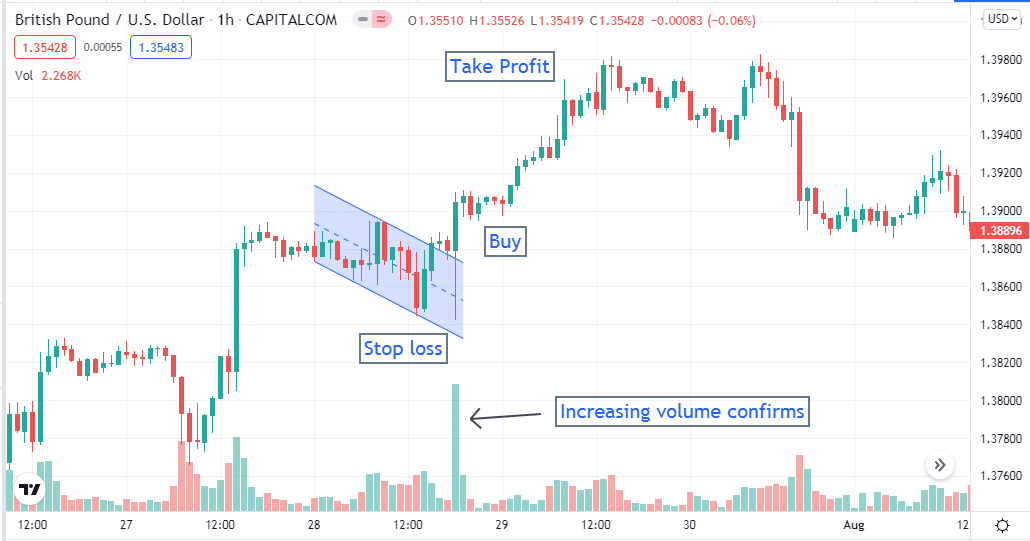
Place a buy order and put an initial stop loss below the flag range with a buffer of 5-10pips. Take profit will be above the flag, same as the flag pole distance.
Bearish trade setup
Confirm the current trend is bearish from the weekly or monthly chart. Seek the bearish flag at the daily chart of the target asset. Wait until the breakout occurs; place a sell order when the price declines out of the flag range.
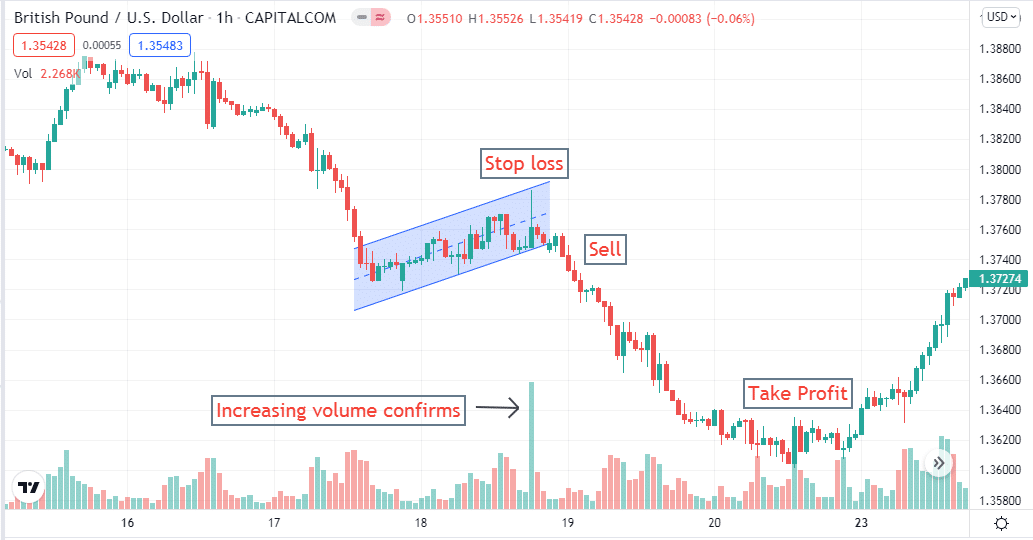
Place a sell order when all these conditions are true. The initial stop loss will be above the flag range with a buffer of 5-10pips, and take profit will be below the flag at the same distance as the flag pattern pole.
A long-term strategy
We use two popular technical indicators, the Average True range (ATR) and the exponential moving average (EMA 50), beside the flag pattern for more accuracy.
This strategy works fine on the daily chart. We confirm the current trend from the weekly and monthly charts, then seek entry at the daily chart. We use ATR value for place stop loss and EMA 20 for exiting from trades.
Bullish trade setup
First, confirm the current bullish trend from the weekly or monthly chart. Then wait for the bullish flag to take place on the daily chart. When the breakout occurs, place a buy order.
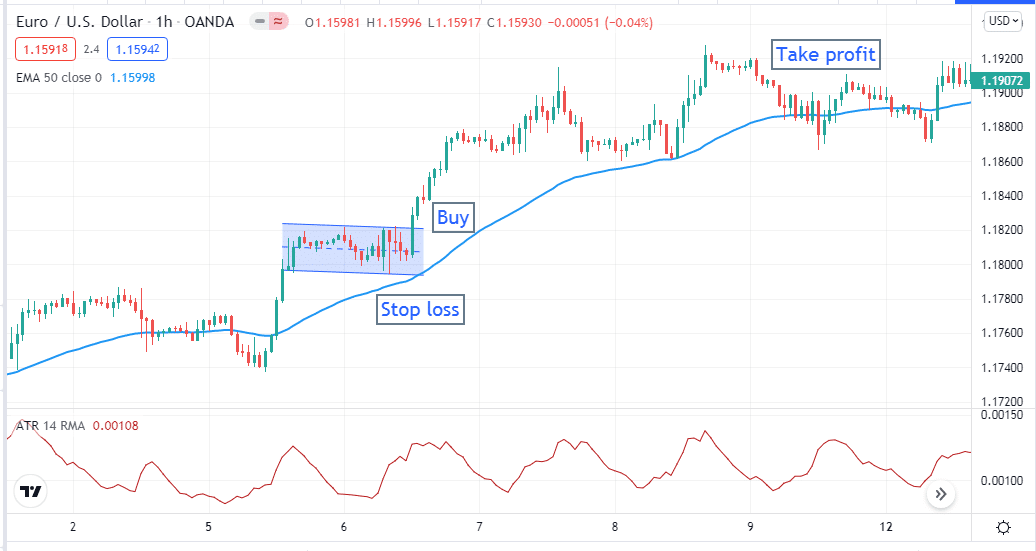
Set initial stop loss below the recent low as the ATR value suggests. In the figure above, the ATR value suggests 14, so we set stop loss below 14 pips from the current low. Continue the buy order till candles remain above the EMA 50 line. Close the buy position when the price candles cross below the EMA 50 line.
Bearish trade setup
Confirm the current trend is bearish from the weekly or monthly chart. Seek the bearish flag at the daily chart of the target asset. Wait until the breakout occurs; place a sell order when the price declines out of the flag range.
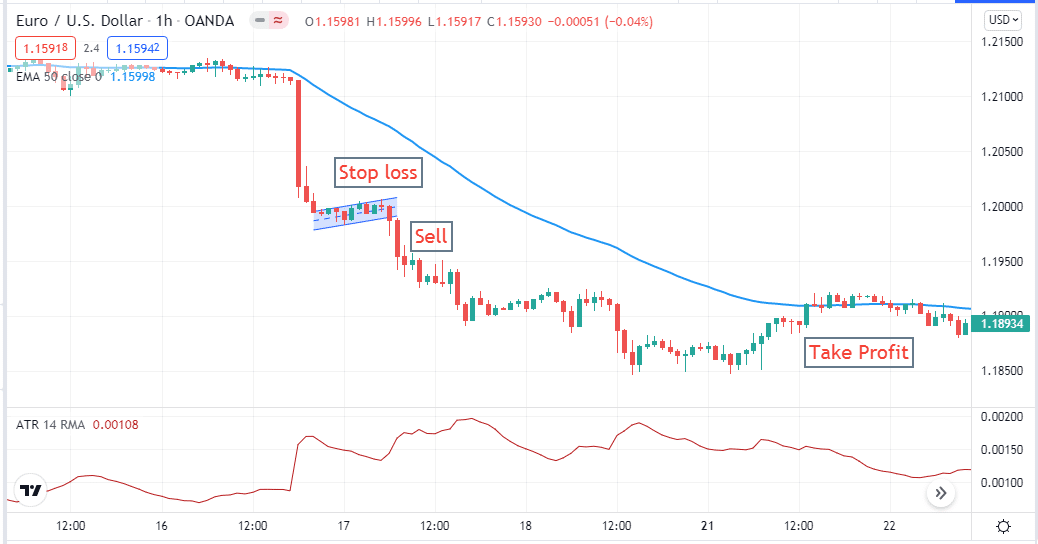
Set an initial stop loss above the recent high as the ATR indicator suggests. In our chart, the ATR value was 17, so we set stop loss above 17pips of the recent high. Close the sell position when the price candles start to cross above the EMA 50 signal line.
Final thought
Finally, the concept is clear about the flag pattern as we list every possible detail in our article. Now you can use these strategies above for your trading or create new trading methods using this pattern.
We suggest acceptable practice in the demo chart before applying any of these strategies for real trading and be aware of these strategies during trend-changing economic events such as interest rate, GDP data, employment data, etc.