- What is the 5-minute strategy?
- How do you always win in binary trading?
- What is the best time to trade binary options?
Right now, binary options trading is one of the most popular trading markets. The trader has to make straightforward calls, and the short-term return makes it attractive for many people.
With the right strategy, you can make money in only five minutes or even less, and it’s no matter of luck. There are consistent strategies that, when appropriately applied, can give you a high winning probability with a minimum risk. The methods used are many and depend a lot on the trader’s preferences.
Let’s go through some of the most important trading strategies that will help you improve your experience.
How do traders profit from binary options?
To make a profit in binary options, the trader has to be right about the price direction. In some sense, it’s like a bet. The broker collects all the bets and gives the prize to the winner. The difference here is that trading successfully has nothing to do with gambling. The trader doesn’t guess where the price is going but looks for patterns and signals that may help the trader to decide if the price will rise or fall.
Why do you need to have a strategy?
Strategies are made so you can avoid gambling and trade like a pro instead. They combine several signals, and once some or all of the conditions are met, they trigger the call.
Having a strategy helps the trader to avoid bad habits and make a more systematic and reliable decision.
Is there a variety of strategies?
Short-term traders are technical. A five minutes trade does not reflect the sentiment of the market or how some news may impact the price of the asset. So, five minutes trading relies mainly on technical analysis. Here are some of the best types of strategies.
Price action strategies
These are the more basic types of strategies. They go on the most fundamental goal of trading, making money, or avoiding loss. Traders who base their strategy on price always look at price charts and find patterns and trends that help them forecast the subsequent movement of the assets.
Price action strategies are ideal for beginners due to they are more straightforward and right to the point. However, the price is sometimes the last to reflect the market changes, and you are risking entering the position late.
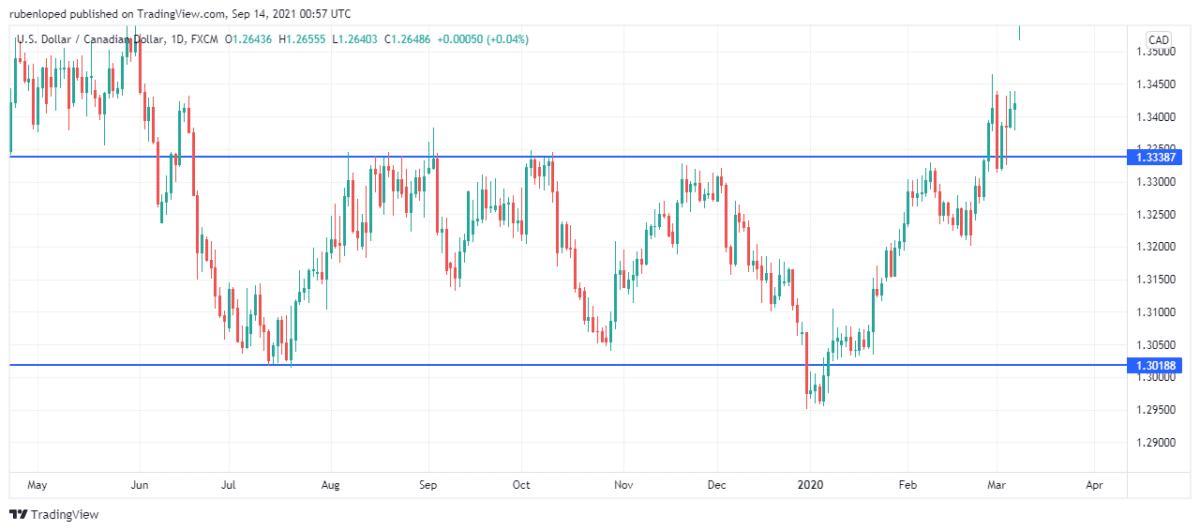
Support and resistance lines are patterns commonly used by traders to establish the zone where the price is moving to make long and short positions accordingly.
Price action strategies are useful for short-term trades because the impact of big news or intrinsic value is limited in the short term, and the asset price depends mainly on demand and supply.
Some of the most used price action strategies are:
- Pin bar
- Inside bar
- Trend following retracement entry
- Head and shoulders reversal trade
Scalping
It is the trading technique of making quick trades to get small but consistent earnings. Scalping strategies are ideal for five minutes trading. You may even say that five minutes of binary options trading is scalping. Now, there is a difference between traditional scalping trading and binary options trading. When scalping, the trader should avoid one bad trade erasing many small earnings, while the loss is always limited with binary options.
One good strategy for scalping is using RSI.
Scalpers wait until the RSI reaches 30% and then moves up to enter a long position. On the other hand, when the RSI reaches the 70% level and then starts to move down rapidly, the trader should enter a short position.
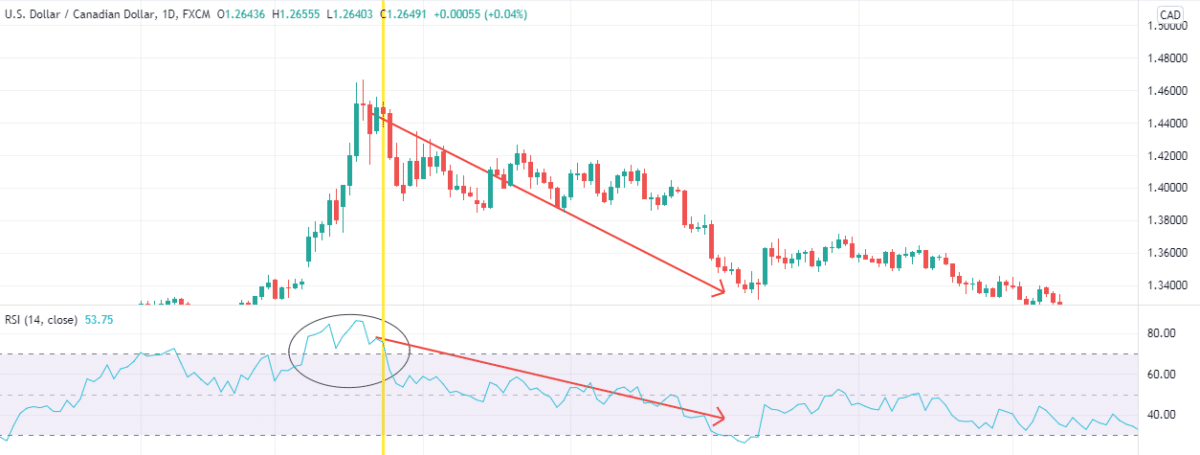
We can see how the price began a downtrend after exceeding the 70% level that coincided with the RSI downtrend.
Some other successful strategies are:
- Scalping with parabolic SAR indicator
- Scalping with the moving average
- Scalping with the stochastic oscillator
Japanese candlestick strategies
The Japanese candlestick chart is the most used in the trading world. Its practicality makes it a great way of visualizing information quickly and designing graphic strategies. The use of patterns is extremely popular with Japanese candlesticks charts, and the variations of this chart like Heikin Ashi can be considered strategies themselves.
When talking about Japanese Candlestick strategies, we must refer to candlestick patterns which are figures created on the chart and predict the future development of the price.
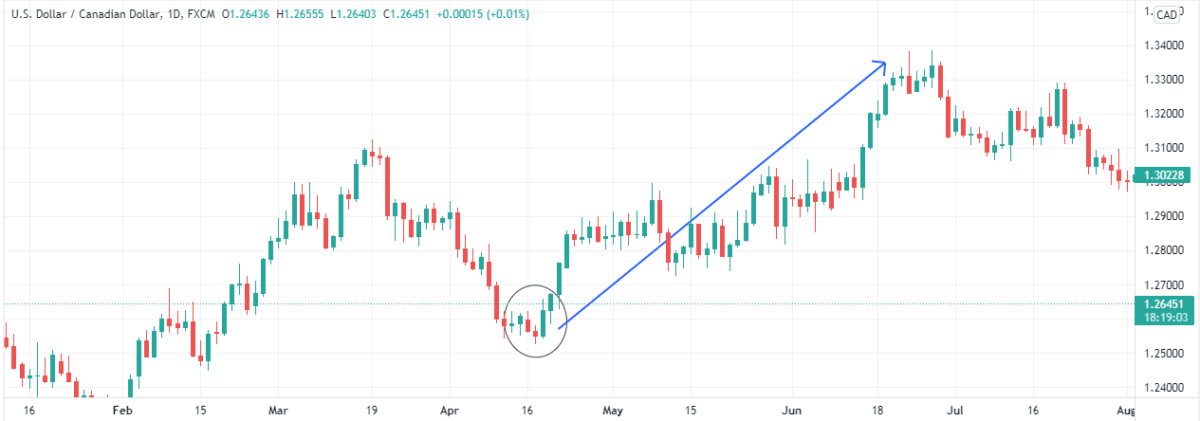
In the chart, we can see an engulfing pattern predicting an uptrend. Some other candlesticks patterns are:
- Hammer
- Doji
- Hanging man
- Three white soldiers
Momentum/swing trading
The momentum refers to price movement strength, while the swing relates to the moment the trend reverses. Strategies based on momentum/swing enter positions when a trend’s minor corrections occur. The point of this is to make money on each small opportunity. But also in case, the retracement is not a correction but a long reversal, entering early and magnifying the profits.
One momentum/swing strategy is the trend pullback. To apply this strategy, you need to wait for a minor reversal on the main trend and then enter your position before the primary trend continues.
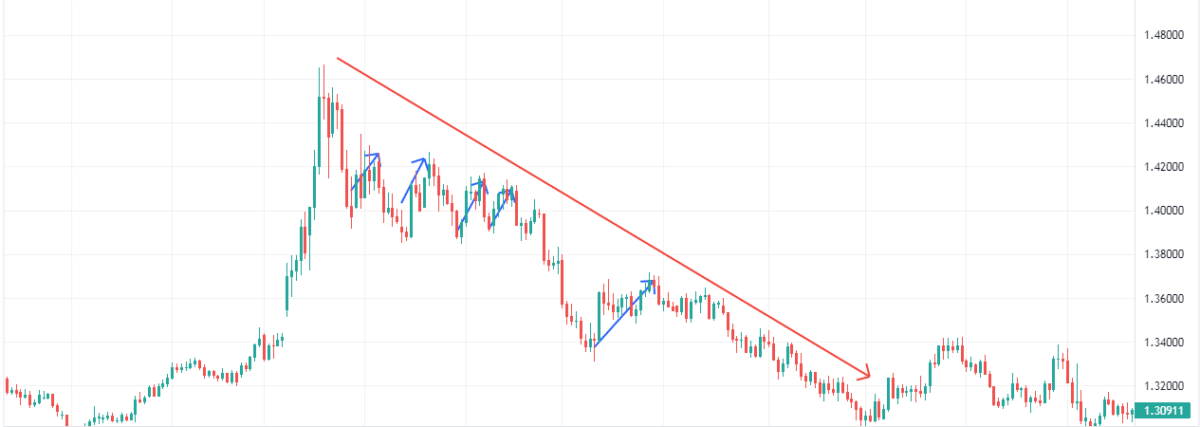
This chart shows a red arrow showing the main trend, while small blue arrows represent small corrections that momentum/swing traders can use to enter positions.
Another momentum/swing strategy is:
- Breakouts from consolidation
Trend trading strategies
The trend trading strategies are, right next to the price action strategies, the more intuitive strategies. When trading, you want to buy when the price goes up (uptrend) and sell when the price decreases (downtrend).
To be able to follow the trend, the use of indicators is the most successful tool. The moving average is a commonly used tool to predict trends. When the price is above the chosen moving average, this is an indication of an uptrend.
Otherwise, if the price is below the MA, it’s indicative of a downtrend. In short-term trading, using EMA makes more sense since the data used in the indicator is more recent.
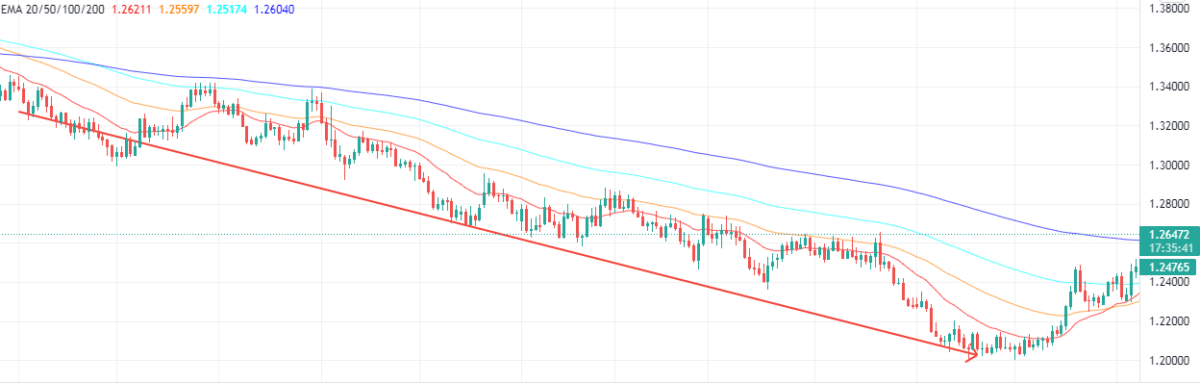
On the chart, we can see the 20, 50, 100, and 200-periods EMA. The more indicators confirm our prediction, the stronger it will be.
Final thoughts
The five minutes binary options trading is an exciting way of making a profit quickly. However, if you think that making a profit out of binary options is easy, well, you should know that losing money is much easier.
As with every trading market, you should make sure you develop a strategy so that you won’t be a part of the big majority losing money. There are many options you can go with. It’s just a matter of trying every strategy and seeing what is best for you.