- What is the HMA?
- Why is it worth using?
- What are its bearish and bullish setups?
The Hull Moving Average (HMA), developed by Alan Hull in 2005, is a type of Weighted moving average (WMA). As with other types of MAs, the HMA tells you about the direction of the trend.
What is the Hull moving average?
It is a trend indicator with a directional bias. It captures the market’s current situation and compares it to past data to determine whether trends are bullish or bearish. A mixture of WMAs makes up the HMA indicator. It prefers recent price changes over previous ones.
As a result, a dynamic yet smooth-moving average emerges, capable of identifying the dominant market trend. Certain market participants also use the indicator to time their entry and exit points.
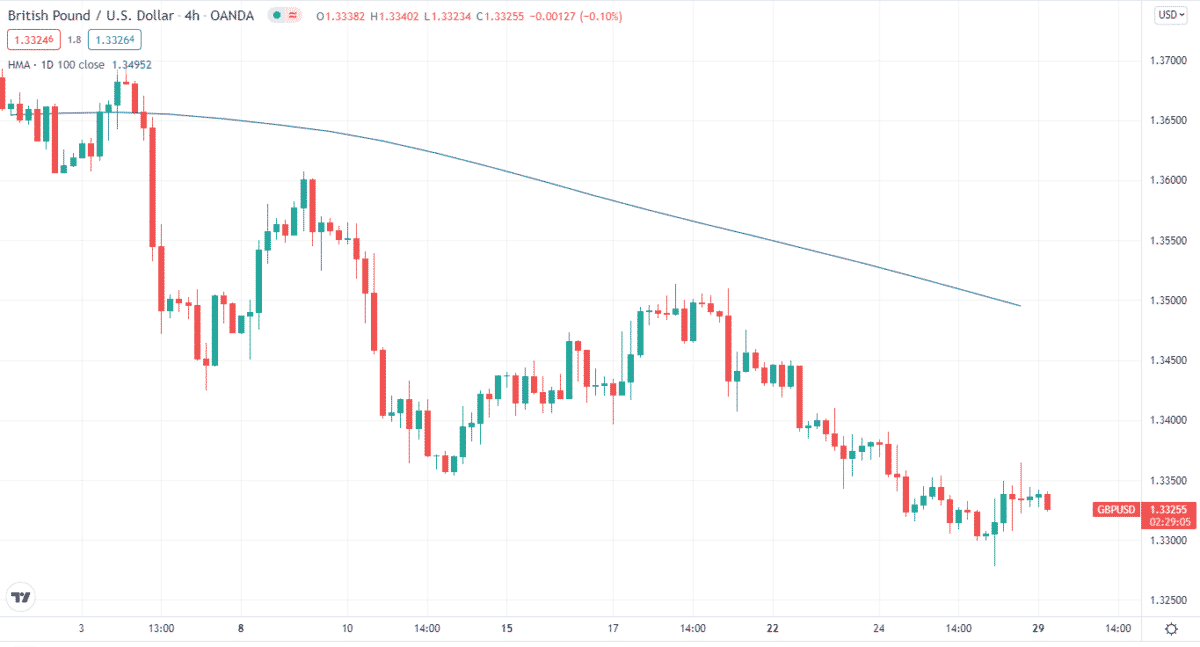
Here’s a chart of HMA. Again, we applied 100 days for the indicator. As you can see, the price is below the 100-day HMA suggesting a downtrend. We’ll explain the bullish and bearish setups later.
In terms of interpretation, the HMA is fairly similar to other MAs. It is, however, geared to solve their major shortcoming, which is their failure to separate market noise from lag.
Because of this, the HMA differs from other MAs in that it reacts faster to price fluctuations and can assist in confirming a trend or suggesting a price shift at the proper moment.
What’s the formula for HMA?
It’s simple to figure out how to calculate the indicator. But, first, we’ll need to understand how to work with the WMA. To begin, make a WMA with a period of “n/2” and multiply it by two. Follow the steps below to calculate.
Then, every period “n,” calculate a WMA and subtract it from the one found in step 1. Finally, using the data from step 2, compute a WMA with a period equal to the square root of “n.”
The formula for the HMA is:
HMA = WMA (2*WMA(n/2) WMA(n)), sqrt(n)
Why is HMA worth using?
As mentioned earlier, it uses recent price movements to evaluate if market conditions are bullish or bearish compared to historical data.
Knowing this should help you read the indication quickly. The HMA is usually shown in two dimensions on most trading platforms. So you have a directional value as well as a positional value.
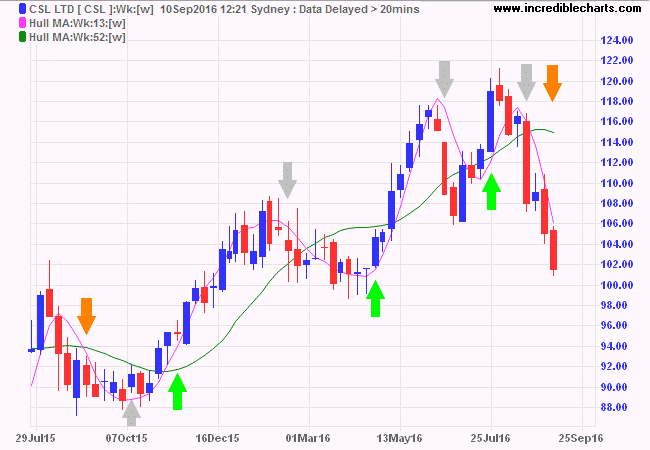
Alan Hull claims that the indicator’s signals are more effective when used for directional signals than crossovers (i.e., when a shorter-term MA crosses a longer-term).
The reason for this is that lag is likely to affect crossovers. So instead, this tool creator suggests looking for entry and exit spots at turning points.
Bullish trade setup
As it is a trend-following indicator, you need to look for an uptrend when finding the bullish setup. When the trend changes its direction, you’ll exit long positions.
Best time frames to use
Before we apply the tool for trading strategies, you need to look at the ideal time frame for the indicator and how they affect its appearance and signals. You can use the HMA to spot trends more successfully if you pick a longer time frame, making HMA a good indicator for long-term trading.
On the other hand, shorter periods are advantageous for day traders or scalpers who want to record price moves as they happen in real-time. When utilizing a shorter period HMA, the entry signals are usually mostly in the direction of the current trend.
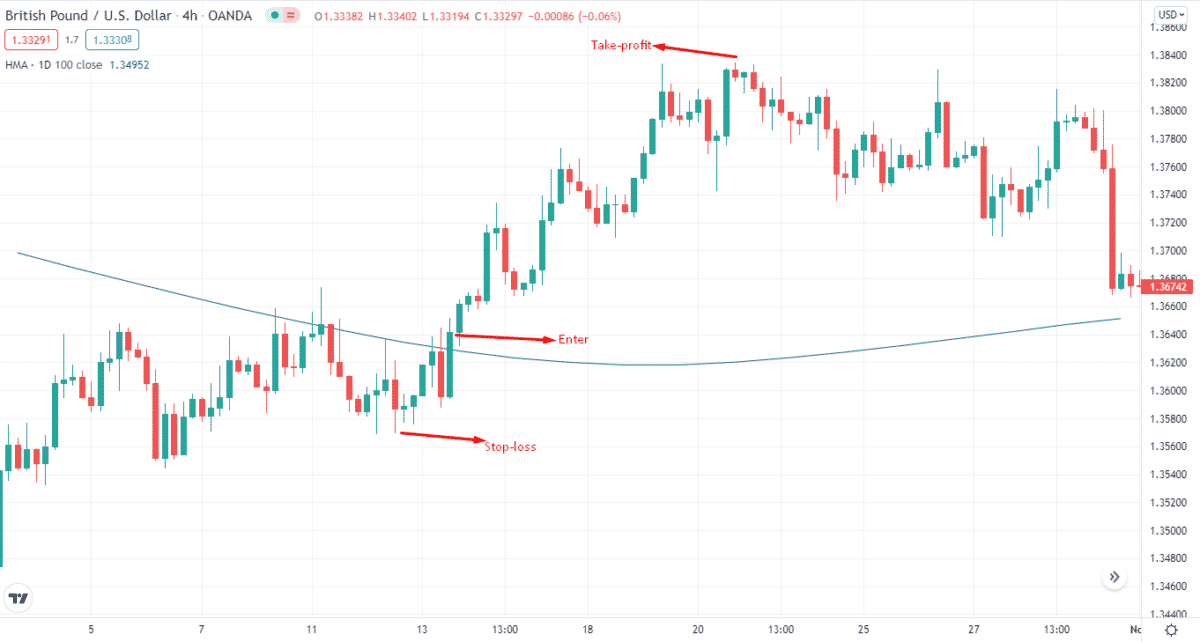
Entry
When going long, you want the HMA to stay below the price. So you enter when the price goes above the HMA. You can also wait to confirm the trend and then take your position.
Stop loss
You can set SL near the low of the buying point.
Take profit
You can set take-profits before the trend changes.
Bearish trade setup
HMA bearish setup
When looking for a bearish setup, you want the HMA to stay above the price. Normally this happens in the downtrend.
Best time frames to use
Like we mentioned in the bullish setup, there’s no definite time frame for pinpointing or taking positions for bearish HMA.
Entry
In case of a bearish setup, you can enter when the price slips below the HMA. Then, you can wait for the trend to continue and then take short positions.
Stop loss
You can set SL near the high of a selling point.
Take profit
You can place take-profits before the trend changes.
How to manage risks?
Prices often follow a cyclical trend that HMA does not reflect. HMA is unlikely to catch any meaningful trend if a market moves around a lot. So, you want to apply risk management in your HMA trading strategies.
If the trade goes in your favor after an entry with a longer-term HMA, you may use a shorter HMA as a trailing stop loss to control the risk of your profits on a successful trade. HMA can keep you in cash during bearish markets and downtrends to prevent significant losses from battling the trend.
In addition, the distance between your price level entry and your MA can assist you in determining the proper position size for your stop loss distance. During a volatile market environment, an HMA crossover signal can filter out false signals.
Final thoughts
It isn’t easy to objectively assess the productivity of this indicator and assume what kind of profitability can be expected. It should be understood that this is not a tool that can become the basis of a trading system, from which signals should be based. It shows trends and, if properly installed, is not bad enough, but this does not mean that it will work effectively in all conditions and phases of the market.
Moreover, the technique changes from time to time due to economic news, so it would be better to supplement the strategy with indicators that will allow for a full-fledged analysis that considers most of the factors.