The bull flag pattern is one of the preferred setup traders like to use before the price of a security rises. This pattern is one of the simplest to spot on a price chart, and the success rate is very high compared to other price action indicators.
The bull flag pattern is suitable for all kinds of assets but is most commonly used as a continuation pattern for stocks and FX pairs. Using this strategy, you can wait for the perfect time to enter a long position and make huge profits when the stock value rises. The technique also has rules to set take profit and stop-loss levels.
By reading this piece, let’s learn how to apply this strategy and what companies will rise in 2022.
What are bull flag stocks?
The kinds of patterns you see in the price chart are similar to the letter F or a flag. They are identical to pennant patterns, but support and resistance lines are parallel in flag patterns.
The flag pattern can be bullish or bearish. This designation depends on what the flag says about where the price is headed.
For example, the bull flag pattern is where the flag part of the pattern seems to be pointing downwards. However, the pattern is saying that the price is about to go uptrend.
The parts of the flag pattern are three:
- Flagpole
- Flag
- Breakout
The flagpole is the uptrend preceding the flag. Therefore, the trend needs to be long compared to the width of the flag.
The flagpole is the consolidation phase of the movement and is the most important part of the pattern. This is where traders keep an eye on the stocks and wait for the breakout to enter. What makes a flag a bull flag is the downwards inclination of the support and resistance level.
The breakout happens once the stock price gets above the resistance level. That is where the trader should enter the position.
Are bull flag stocks worth investing in?
Bull flag stocks are those about to have a breakout, potentially leaving you with huge profits at the end. Bull flags are worth investing in once all the indicators signal that the price is about to rise. You must avoid false breakout and always try to confirm the pattern with other indicators. Getting in a bad trade can wipe out your account in no time. See which companies are set to have a great year based on bull flag patterns.
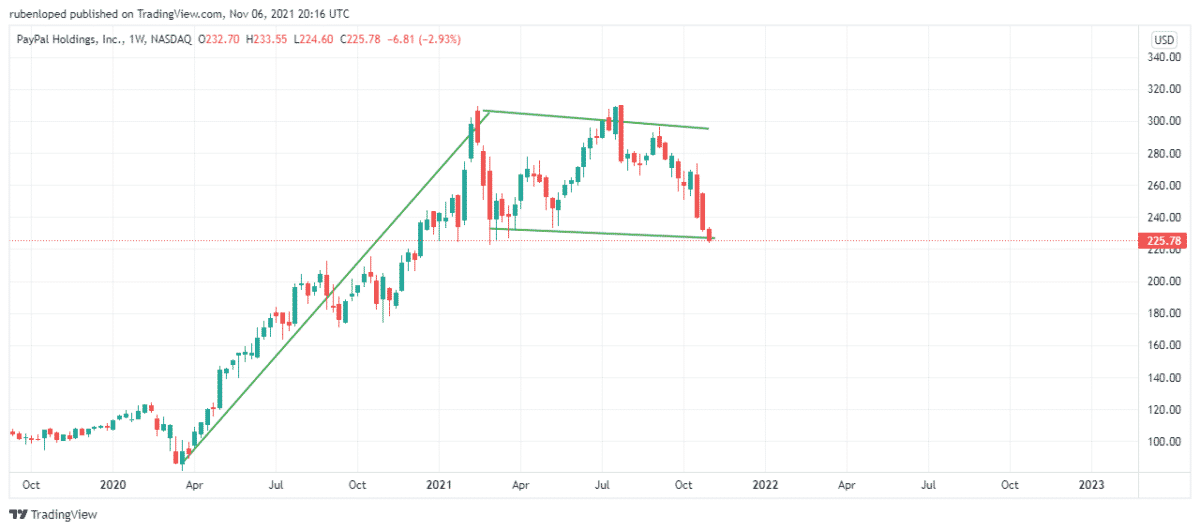
Paypal Holdings, Inc.
It is a fintech company known around the world for offering online payments solutions. The company is one of the largest in its field, and their services benefit both companies as individuals. Moreover, Paypal is a still-growing company that is now expanding to new sectors but making its position as a global payment option stronger. In 2020 it launched interesting products such as Venmo credit card and QR code payments for PayPal’s mobile apps.
The company experienced a huge uptrend since April 2020 that made the stock price almost four times what it worthed by the beginning of the trend. That lasted until the end of February 2021, where the stock price entered a consolidation phase creating a flag that seems to be ready to explode in 2022.
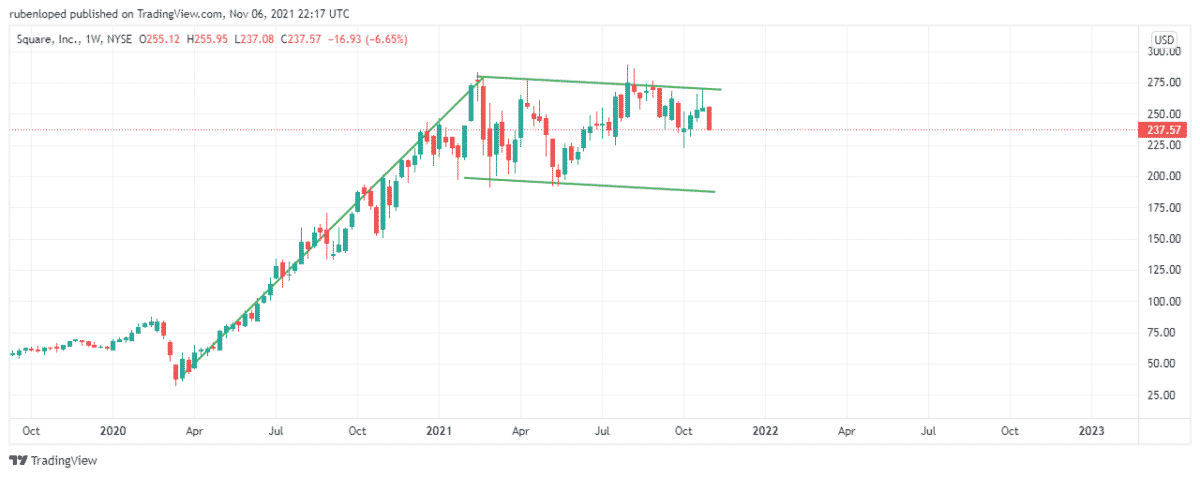
Square, Inc.
It is another fintech company founded in 2009 and is based in San Francisco, California. The company is engaged in the provision of credit card payment processing solutions. The company offers services to two main clients. The first is retailers that receive payment solutions. The second is individuals. For them, there is a cash app to send peer-to-peer payments.
Like many technology companies that facilitated this kind of service, the pandemic was a huge opportunity. Since April 2020, their stocks have risen to almost seven times more valuable than they were worth at the pandemic. The growth stopped in February 2021, and the consolidation phase began. After nearly a year of testing the support and resistance level, 2022 could be when the company retakes the uptrend.
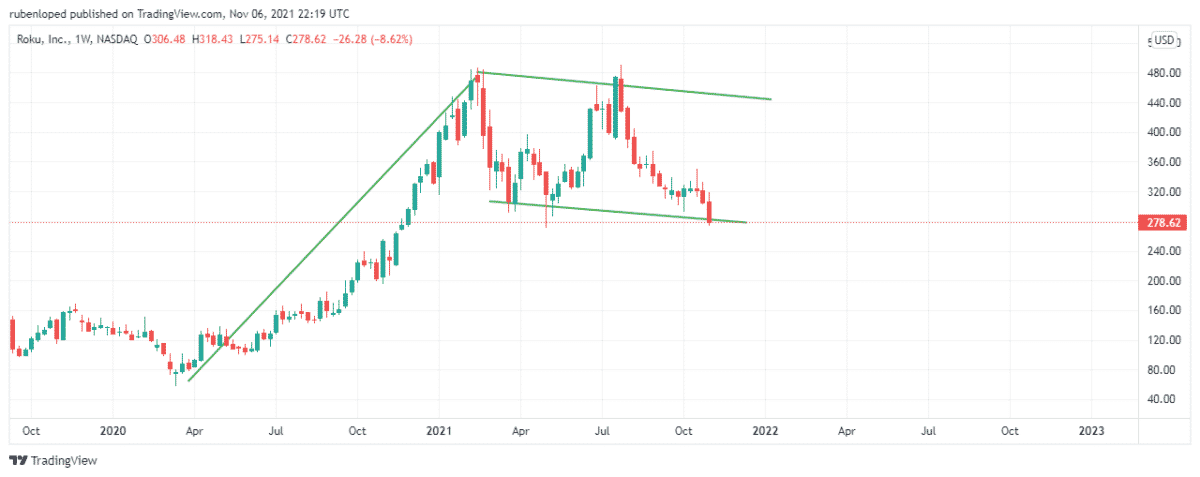
Roku, Inc.
It is an American company founded in 2002 and headquartered in San Jose, California. It engages in the provision of streaming platforms for television with two business segments: players and platform.
The company started growing in march after the Covid-19 was declared a pandemic. From that moment, the whole world started investing in their homes, and Roku was a great option for everybody to upgrade their TVs.
The growth stopped in February, following many companies that took advantage of the covid crisis. Since then, the stock’s price has been moving between $280 and $475.
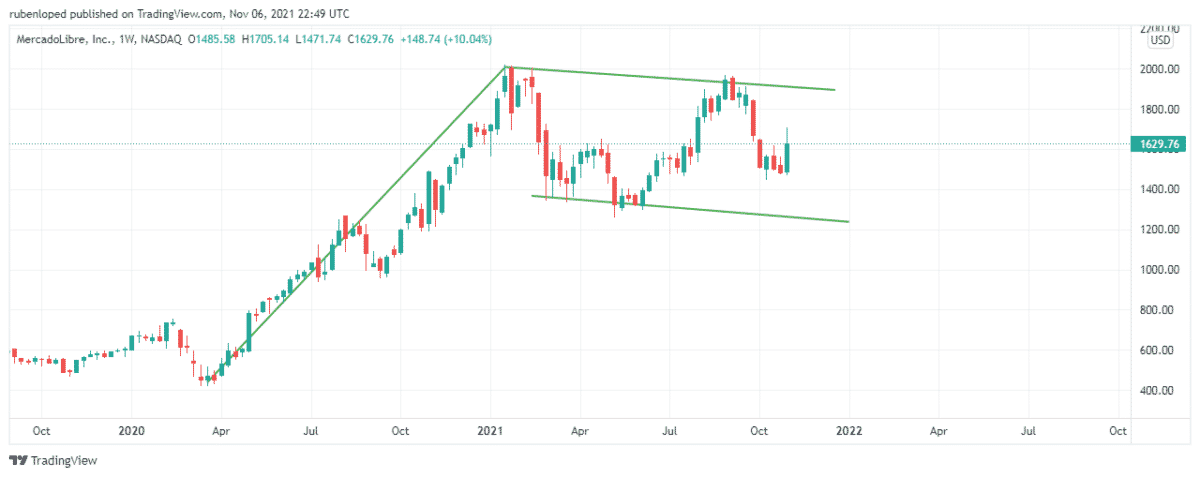
Mercadolibre, Inc.
It is an Argentinian company founded more than 20 years ago, and today it is in 18 countries. The company is the leading e-commerce company in the region. It is ready to grow year after year as online commerce gets the penetration rates to increase in Latin America.
After the Covid crisis seems to be ending, Mercadolibre faces the challenge of consolidating its position in the region. Over the past ten years, the company grew more than 2700%, so it has been working hard for a long time. However, the pandemic helped Mercadolibre as it did with many other e-commerce brands.
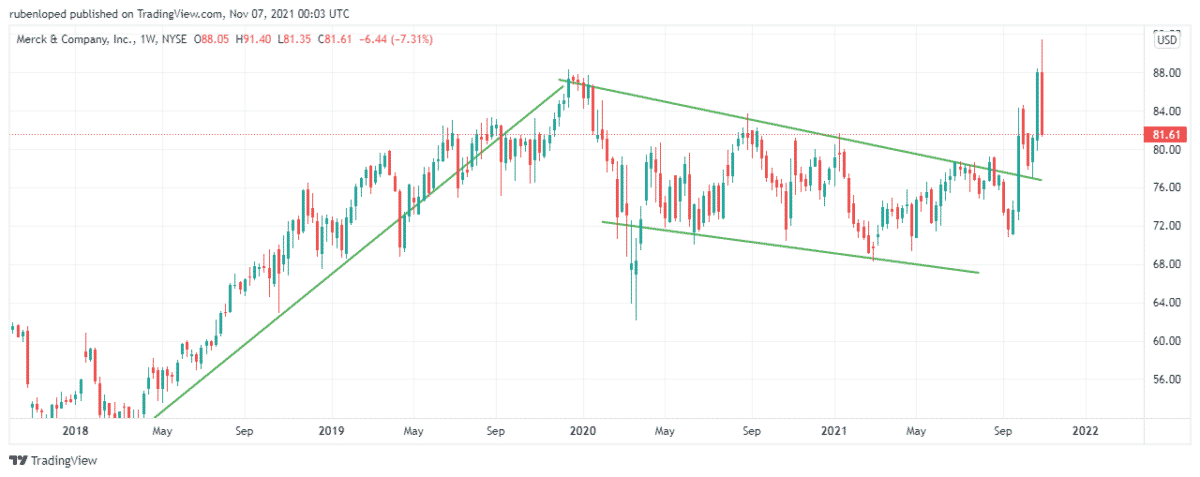
Merck & Company, Inc.
It engages in the health business providing prescription medicines, vaccines, biologic therapies, animal health, and consumer care products. Recently the company released its Q3-Results where we can see a better than expected performance mainly due to the rise in the sales and the improvement in their margins.
Contrary to the other recommendations, the time frame used to draw Merck’s Flag pattern goes from 2018 to now, which means that the breakout will take longer, but it also means that the indicator is stronger. Also, the good news is that the breakout seems to have started already.
Final thoughts
The bull flag pattern is a great way of looking at the market. However, its guesses need to be confirmed from other indicators and fundamental analysis, especially when discussing long time frames like next year’s investments.