- What is volatility?
- Why is volatility important?
- Where can I find volatile stocks?
Volatility is the principle of trading. The up and down movement of prices is necessary so traders can sell when they are high and buy when they are low. The size of that up and down fluctuation is called volatility.
Thus, the more significant the difference in prices, the greater the profit. Finding volatile stocks is an excellent way of increasing gains. Let’s take a look at some of the more volatile stocks and how to trade them.
What is volatility?
Volatility measures how much the price moves from one side to the other concerning the asset price in a given time. A simple way is that volatility is the difference between the highs and the lows of stock in a time frame divided by the stock price.
For example, a stock that moves $10 daily with a stock price of $100 is more volatile than a stock that moves $10, but its price is $200 on average. So, volatility is a relative measure.
Why is volatility important?
From an investor’s view, volatility is something you want to avoid. The higher the volatility, the higher the risks. However, a trader can profit from volatile markets. Traders make profits out of the market’s movement. So if we have big fluctuations in prices, the possibilities to make money increase. However, the risks are still there, and volatile trading requires a lot of experience and strategy.
Where can I find volatile stocks?
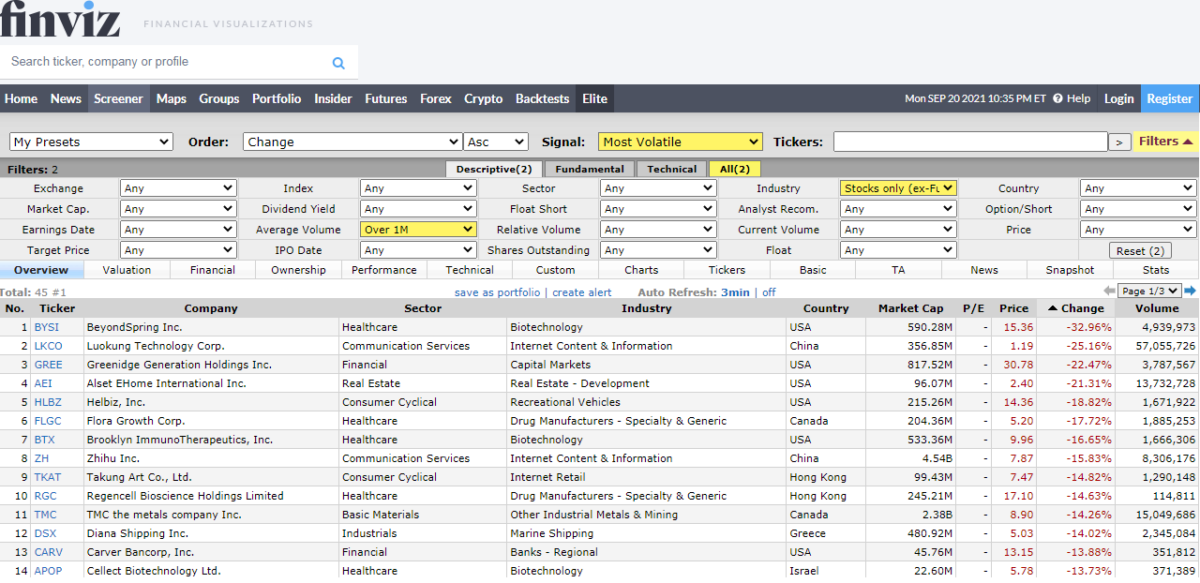
Finding volatile stocks used to be a manual job. It required us to look at stock charts one by one and decide which ones were good options. Today this is an easy job, and many stock screeners show us which stocks have had high volatility in the time frame we choose.
One good choice is finviz.com. Here, with just a few filters, we can get a list of stocks with high volatility. Also, tradingview.com has an intuitive interface through which traders can see the most volatile stocks.
How to trade volatility?
So, we all know that the trading principle is selling high and buying low, but this is especially the case with volatile markets.
If we can find a regular price volatility pattern, we could draw a support and resistance line. If that is the case, this would be the most straightforward option to trade. However, that’s not always the case, and the price chart doesn’t give us enough information to know when the price is reversing. For those kinds of volatile markets, we recommend using other technical indicators that reflect the state of the market beyond the price.
A great option is the RSI. Looking at their bands, the trader can know when the price changes its course so that the trader can buy or sell accordingly. For example, with RSI, once the indicator surpasses 80%, we can assume that the price is about to go down, so it’s time to sell. On the other hand, once the indicator goes below 20%, we can assume that the price is about to uptrend, and it is time to buy.
Let’s see next some of the most critical volatile stocks on the market.
1. Apple Inc. (AAPL)
It’s a leading technology company dedicated to the design and manufacture of different technology-related products. It was founded in 1977, and today it has a presence all over the world.
Apple’s market capitalization is $2414.40B. The highest trading volume in the last 30 days was 140,155,940 shares. The lowest was 48,242,838 shares. Apple has a 5y monthly beta of 1.20, making this stock a high volatility stock that swings more than the market.
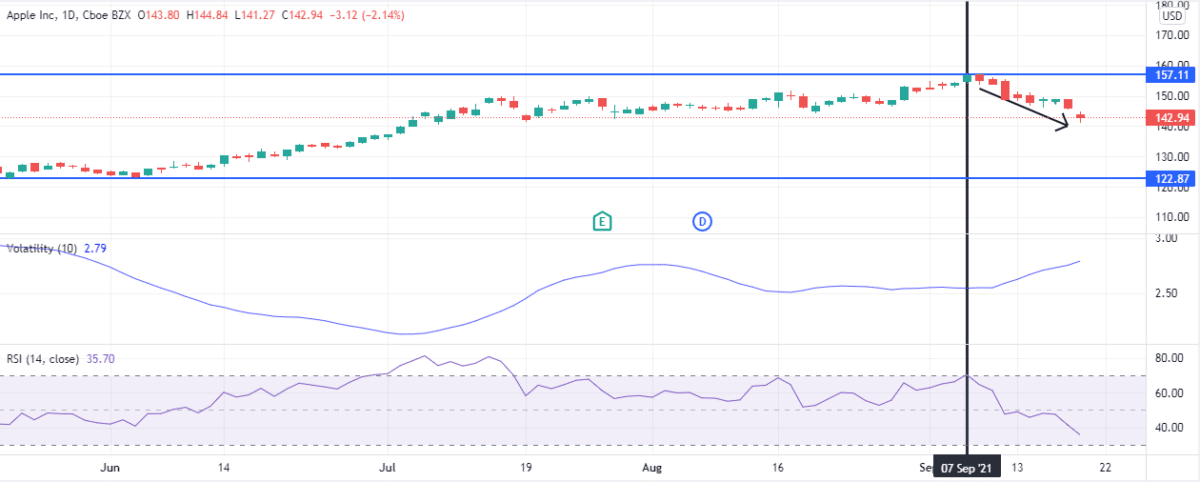
In the last three months, the highest stock price was $157.11, and the lowest price was $122.87.
Thus, on September 7, we could correctly predict a downtrend with the RSI index.

2. Berkshire Hathaway Inc. (BRK.A)
It is a diversified company holding multiple subsidiaries across many different industries. Its main activity is the insurance business.
Berkshire Hathaway’s market capitalization is $625.82B. The highest trading volume in the last 30 days was 1,780 shares. The lowest was 735 shares. Berkshire Hathaway has a 5y monthly beta of 0.91, which makes this stock a medium volatility stock. It is worth noticing that the price of each stock is above $400,000. So, the market is not very liquid.
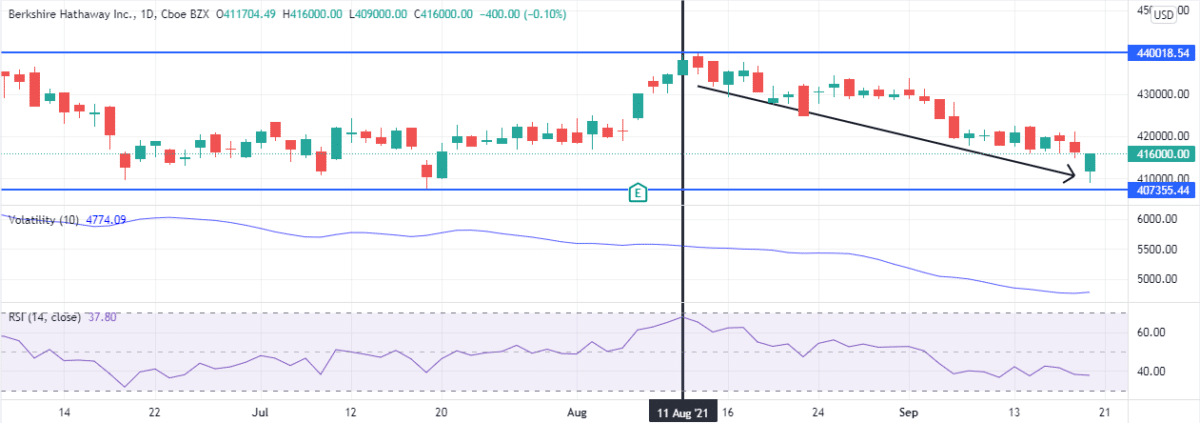
In the last three months, the highest stock price was $440018,11, and the lowest price was $407335.44. On August 11, The RSI began a downtrend, and so began the price, which still is bearish.

3. Amazon.com Inc. (AMZN)
It’s the leading online sales company. It engages in the retail sale of consumer products and subscriptions all over the world. In addition, Amazon resells merchandise purchased from vendors through its online platform.
Amazon’s market capitalization is $1.7T. The highest trading volume in the last 30 days was 4,439,637 shares. The lowest was 1,668,277 shares. Apple has a 5y monthly beta of 1.14, making this stock a high volatility stock that swings more than the market.
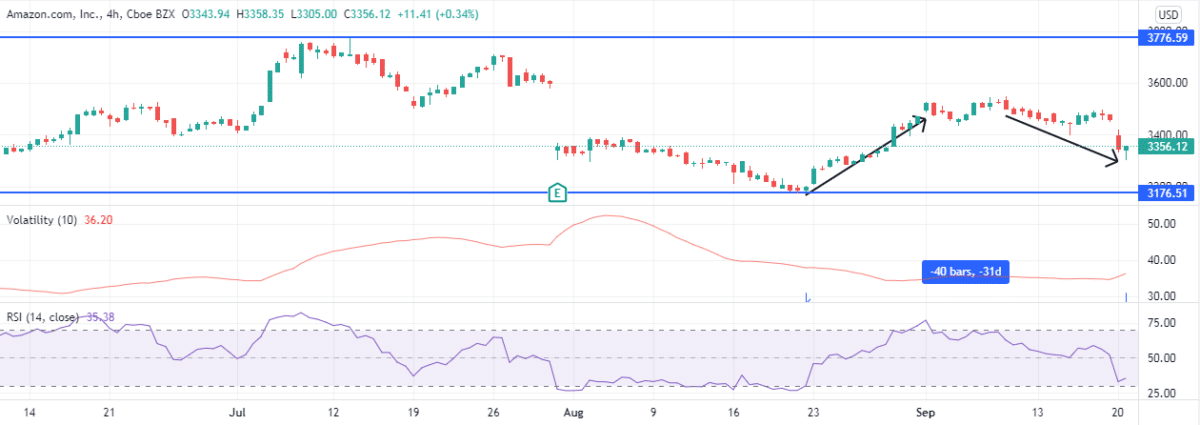
In the last three months, the highest stock price was $3776,59, and the lowest price was $3176,51. On August 20, The RSI uptrend from the 20% level, and so began the price.
Right now, the price is on a downtrend after the RSI reached the 80% level.

4. Alphabet Inc. (GOOG)
Alphabet is a Holding that owns Google, which is the biggest internet company. The company has various segments, but the google segment is also the most important for the company. In addition, Alphabet engages in the acquisition and operation of multiple companies.
Alphabet’s market capitalization is $1.849T. The highest trading volume in the last 30 days was 2,913,713 shares. The lowest was 628,839 shares. Apple has a 5y monthly beta of 1.00, which makes this stock a medium volatility stock.
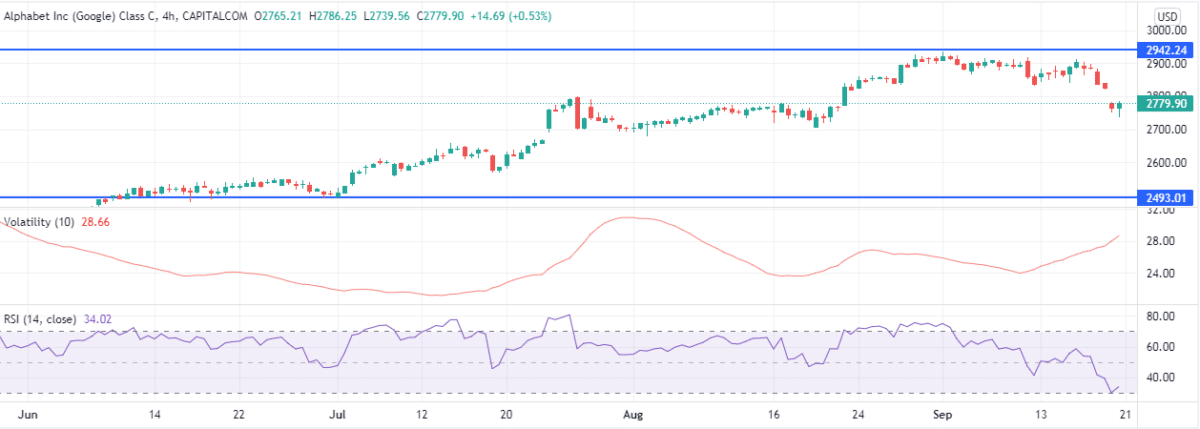
In the last three months, the highest stock price was $2942,24, and the lowest price was $2493,01.

5. Booking Holdings (BKNG)
Booking Holdings is a company that offers through it different companies travel services. Among the companies holding positions are Booking.com, Kayak, and Priceline.
Booking Holdings’ market capitalization is $96.11B. The highest trading volume in the last 30 days was 493,220 shares. The lowest was 170,254 shares. Apple has a 5y monthly beta of 1.26, which makes this stock a medium volatility stock.
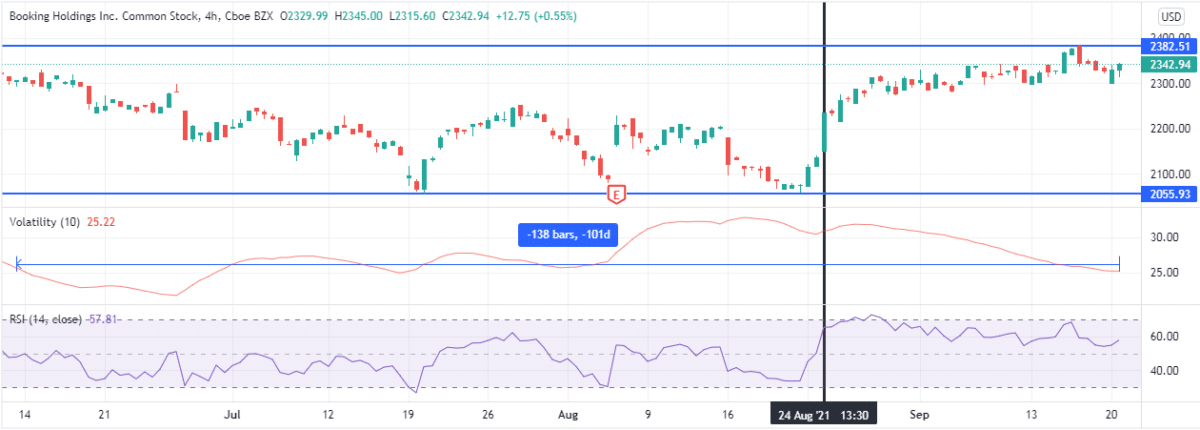
In the last three months, the highest stock price was $2382,51, and the lowest price was $2055,93. In the chart, we can see how since August 24, the RSI has been above 80%, but the price is still trending. For that reason, one must always look for confirmation.
