- What is the volume oscillator indicator?
- How to make a profit with it?
- Which strategies are better to use?
Market participants often make trade decisions according to the volume info. The volume oscillator (VO) is a unique indicator that financial traders use to determine the volume. It enables an increasing success rate on total executing trades when measuring the volume.
However, volume indicators often have nothing to do with the price but volume changes. So it requires an adequate understanding of the indicator component when you want to create a sustainable trading method. This article will introduce you to the volume oscillator. Additionally, we describe trading strategies using the VO indicator.
What is the VO indicator?
It is a technical indicator that uses different moving averages (MA) to determine the volume. Specifically, it uses a slow and a fast MA to define the market context. The default setting for this indicator is 14. So the fast MA volume uses 14 periods, and the slow MA volume uses 28. There is an argument among analysts about the period numbers. Some say these values are very conservative.
Meanwhile, others declare that this period’s values are not sufficiently conservative. The indicator has an insight into the current trends, weaknesses, and strengths.
The formula this indicator use is:
VO = [(Shorter Period SMA of Volume – Longer Period SMA of Volume) / Longer Period SMA of Volume ] * 100.
How to trade using the volume oscillator indicator
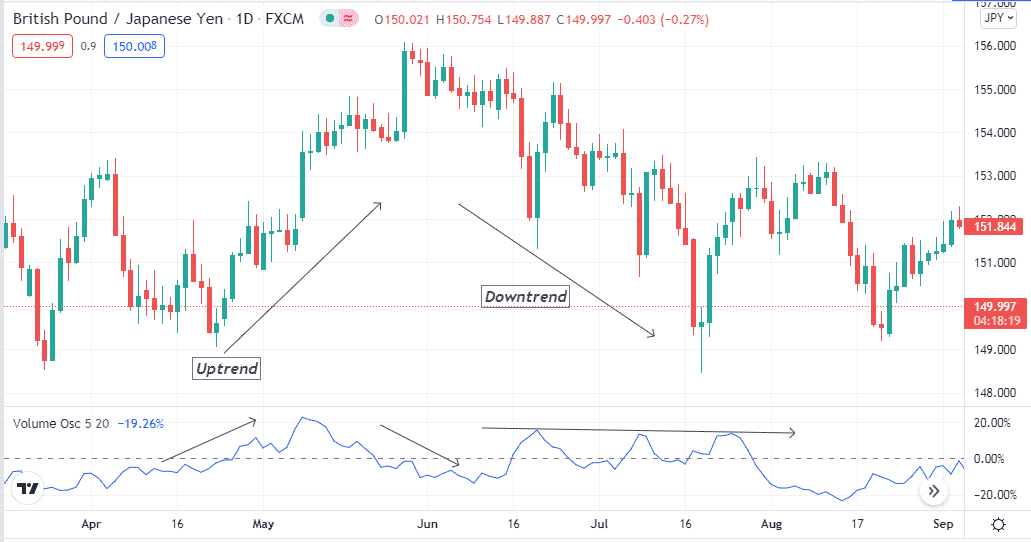
The VO indicator shows readings on an independent window. It contains a dynamic line that moves above or below a central line. The concept is simple: when the fast-moving average exceeds the slow or long-term moving average, the dynamic line of the OV indicator window rises above the central line.
Conversely, when the short-term moving average reaches below the slower moving average, the dynamic line switches below the central line. It is easy to determine reversal or turnaround points through this indicator when the volume measurements and volume momentum agree. You can use the divergence of this indicator reading and combine readings with other technical indicators to generate constant profitable trade ideas.
A short-term trading strategy
Besides the volume indicator, we use the support resistance concept in this short-term trading method. It is usually combines the volume data with the support resistance to generate precious trading positions.
The concept is simple when any breakout occurs by the price movement, match the volume info, and place trades. Using upper timeframe charts, draw support resistance, historical, and critical levels such as weekly-monthly high/low, open/close, etc. And follow the procedures below.
Preferable time frame
This method suits many time frames. We recommend using a 15-min or hourly chart to catch potential short-term trades using this method. Try to execute trades in London or New York sessions as most trading instruments remain volatile during these periods.
Bullish trade scenario
After determining all-important levels, seek to open buy positions when:
- The price movement breaks above any support resistance level that you draw.
- The volume oscillator line reaches above the central line.
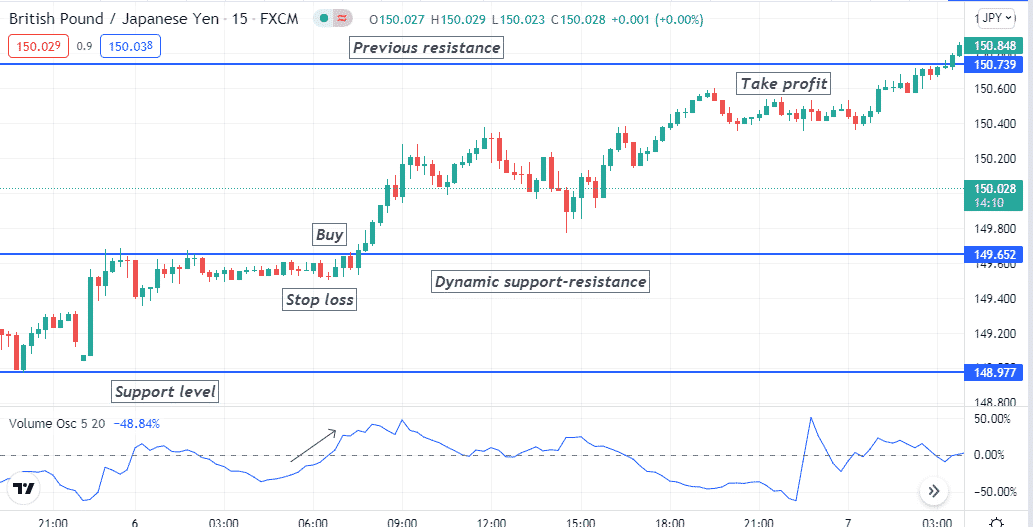
Entry
When these conditions above match your chart, this method generates a buy signal and suggests opening a buy position here.
Stop loss
Place an initial SL below the current swing low of the breakout level.
Take profit
Set an initial profit level below the nearest previous resistance level. You can continue the buy trade if it breaks above the resistance and buy volume remains intact.
Bearish trade scenario
After determining all-important levels, seek to open sell positions when:
- The price movement breaks below any support resistance level that you draw.
- The volume oscillator line reaches below the central line.
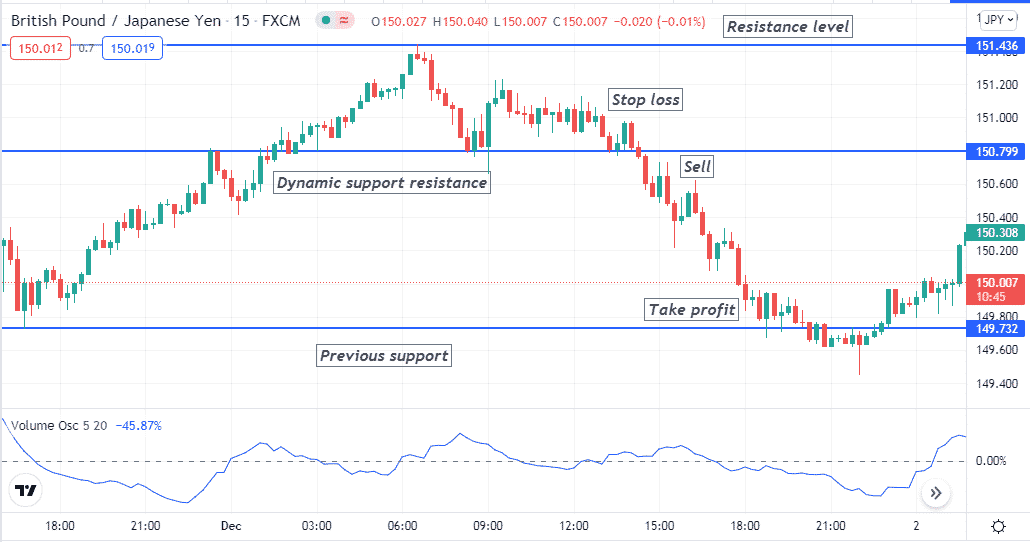
Entry
When these conditions above match your chart, this method generates a sell signal and suggests opening a sell position here.
Stop loss
Place an initial SL above the current swing high of the breakout level.
Take profit
Set an initial profit level above the nearest previous support level. You can continue the sell trade if it breaks below the support and the sell volume remains intact.
A long-term trading strategy
The volume oscillator suits fine on long-term time frames such as daily or weekly. In this long-term trading method, we use the Relative Strength Index (RSI) indicator as a supportive indicator alongside the volume oscillator indicator. The RSI indicator determines trend-changing momentums, and when we combine all this info correctly, it generates potentially good entry/exit points.
Preferable time frames
Use a daily chart to obtain the best results through this trading method.
Bullish trade scenario
Apply those indicators and seek to buy opportunities when:
- The dynamic line is at the central (50) or above and heading to the upper (70) line on the RSI window.
- The volume oscillator reading is above the central line.
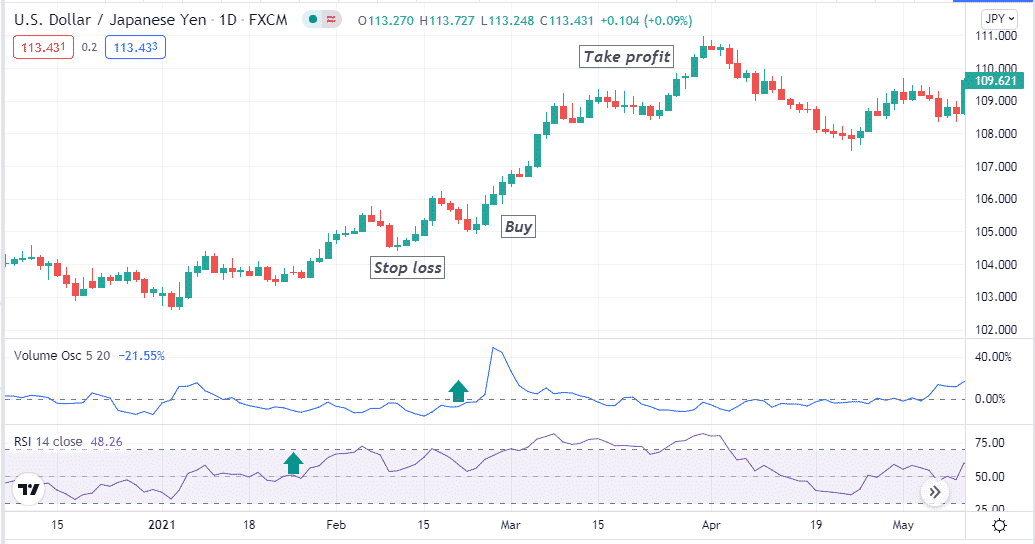
Entry
Match these conditions above with your target asset chart, then place a buy order.
Stop loss
Place a SL below the current swing low of your buy order.
Take profit
You can hold the buy position depending on the market context as long as the price movement remains on a bullish trend.
Otherwise, close the buy position when:
- The RSI line reaches the upper (70) level or comes back toward the central (50) line after reaching that level.
- The VO reading declines or reaches below the central line.
Bearish trade scenario
Apply those indicators and seek to sell opportunities when:
- The dynamic line is at the central (50) or below and heading to the lower (30) line at the RSI window.
- The volume oscillator reading is below the central line.
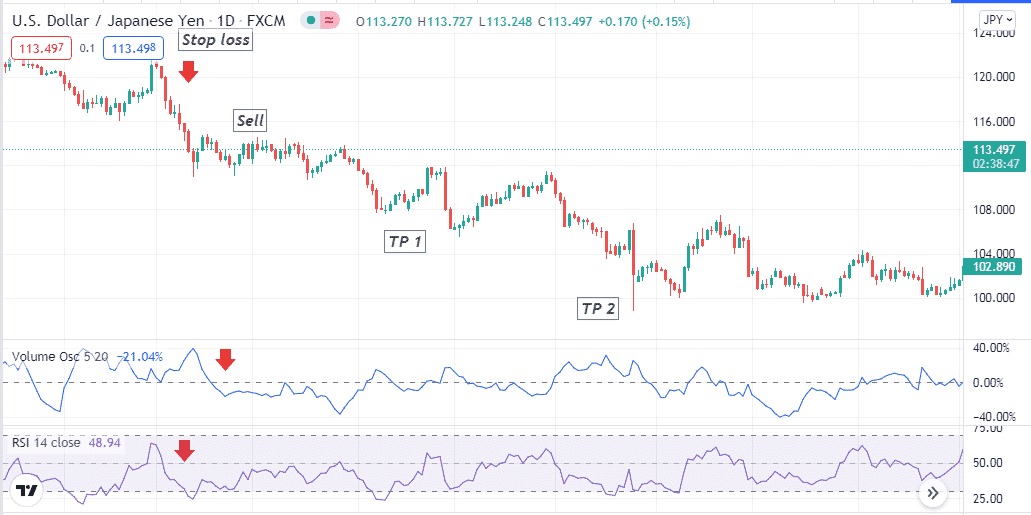
Entry
Match these conditions above with your target asset chart, then place a sell order.
Stop loss
Place a stop loss above the current swing high of your sell order.
Take profit
You can hold the sell position depending on the market context as long as the price movement remains on a bearish trend. Otherwise, close the sell position when:
- The RSI line reaches the lower (30) level or comes back toward the central (50) line.
- The VO reading rises or reaches above the central line.
Pros:
- It allows making trade in the direction of significant participants.
- It applies to many trading assets.
- You can reduce risks on executing trades using this indicator.
Cons:
- It generates false signals in lower timeframes.
- This indicator can fail due to fundamental events.
- Executing trades only relying on the VO indicator is not a wise idea.
Final thought
Many market participants execute approx 77% successful trading positions using volume info on their trading. Combining other indicators will increase your potentiality to determine more accurate entry/exit positions. We suggest being aware of blips that occur due to many fundamental reasons. Follow reliable sources of the economic calendar to obtain fundamental info and avoid blips.