- What is the Marubozu pattern?
- How to identify this technical figure?
- Is it worth using by market participants?
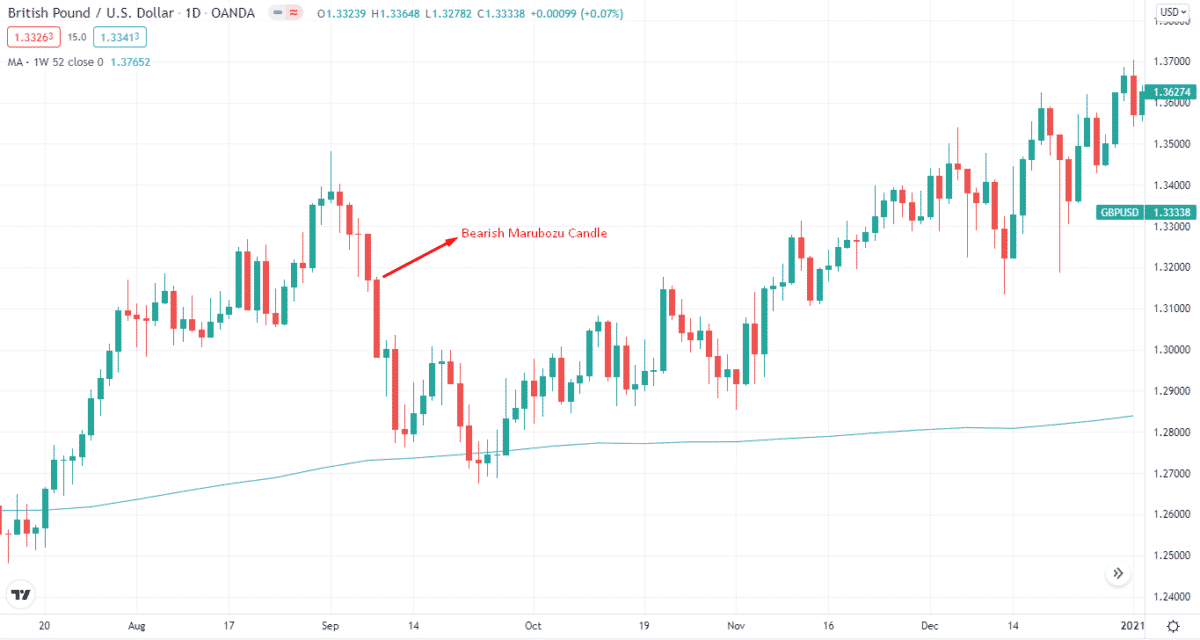
The “Marubozu” is an easy-to-navigate one candle pattern that indicates the direction of a trend. This word means the baldhead in Japanese. It is true because this candle has no wicks or shadows. Its structure suggests that opening and closing prices are the same as the high of the candle.
What is the Marubozu pattern?
It indicates that the price began at a high, ended at a low, and vice versa. When you employ it in technical analysis, you can learn many constructive things. Its shape shows that price has been significantly moving in one direction, either bullish or bearish for novice market participants. Second, the candle can give some vital information in predicting the price’s future direction.
The pattern appears in an uptrend/downtrend in the bullish version. Conversely, the candle appears in a downtrend/uptrend in the bearish version.
How to identify it?
When finding it, you should look for the following conditions:
- It is a large candle that is double the size of a conventional candle.
- There aren’t any wicks at the top or bottom.
Although the candlestick has no wicks, finding a massive candle without wicks is quite tricky. As a result, a Marubozu can be defined as a large candle with a bit of wick.
Three different forms
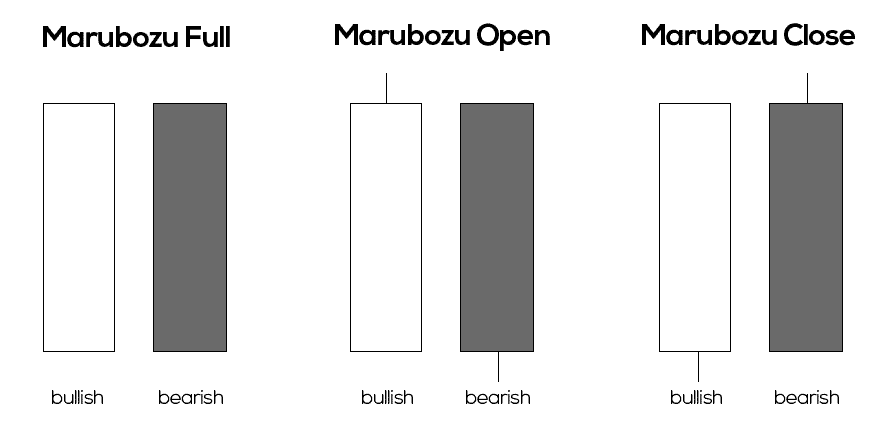
| No wick pattern | With a bullish higher wick and a bearish lower wick | With a bullish lower wick and a bearish higher wick |
| This candle has both an open and a closed flat surface, and there are no wicks on the entire candlestick. This indicates that a crypto or an asset started a period moving in a specific direction and continued to move until the very end of the period. | This candlestick indicates that the period’s opening was even, indicating that the asset price has moved in only one direction since the beginning of the period. However, it did not close the period until some correction in the opposite direction. | It is the same as the opening candle of Marubozu, just the opposite. The price could move in one direction after the session’s opening but continued to rise in the opposite direction until the session’s close without any recovery. |
A key point to remember is that there can’t be wicks on both ends of the candle. One of the candlestick’s ends must stay flat. The longer the candle burns, the more effective it is.
Is it worth using?
You can benefit from this technical figure since the pattern indicates a trend reversal and continuation. The trend is likely to continue when the Marubozu occurs following a breakthrough. The candle adjacent to Marubozu can demonstrate that the trend is still going strong.
You should not enter the trade if the candle close to the Marubozu isn’t bullish or bearish. For example, if a trader sees the figure Marubozu in an uptrend, but the candle next to the pattern is not bullish, the trend is not strong enough.
A trend reversal can also be detected using this candlestick. A price reversal pops up when the pattern comes around the support and resistance levels. After Marubozu appears, you can start taking positions.
Bullish trade setup
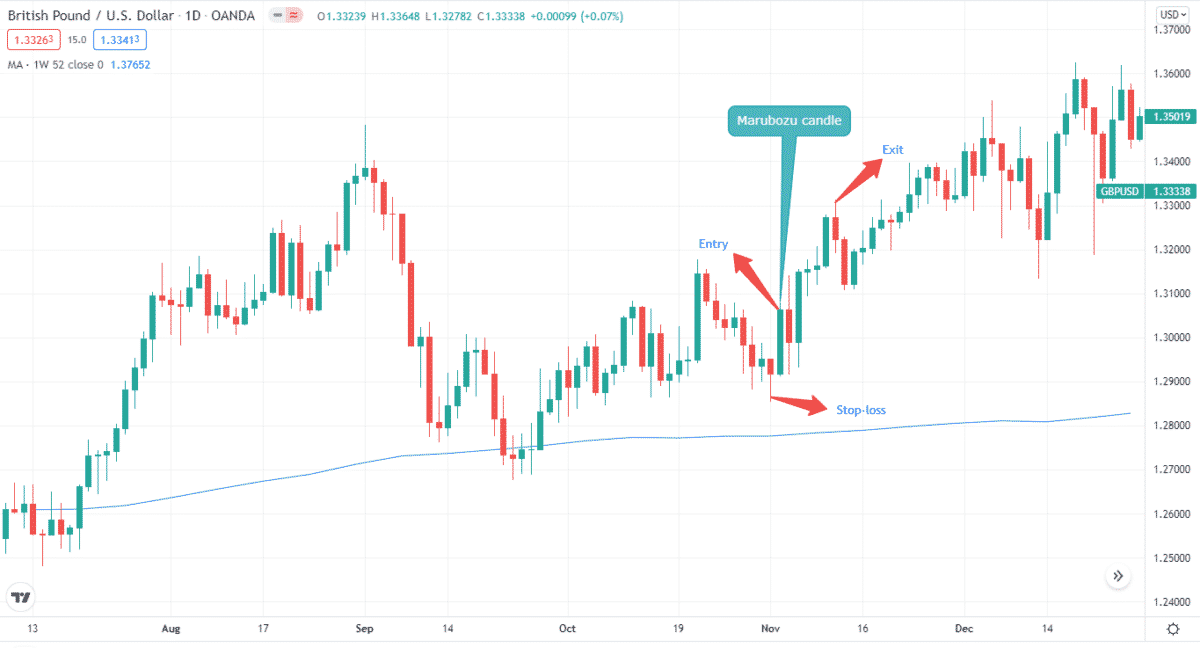
Here’s how you can trade the bullish setup. When looking for a bullish Marubozu, you must find the candle in an uptrend or downtrend. In continuation, you need to find the candle in an uptrend. Conversely, in a reversal pattern, you need to locate the candle in a downtrend.
Best time frames to use
There’s no specific time frame for identifying or taking positions for these candles. However, applying short-term strategies is better to find the pattern in more extended time frames. This is because there’s a lot of market noise when you apply shorter time frames.
Entry
There are two options for entering the bullish Marubozu. Either you can enter at Marubozu or at the candle next to it. Either way, it’s better to wait for the pattern to develop before entering the trade.
Stop-loss
You can set SL near the low of the buying point. For example, it can be near the low of Marubozu or a recent low in general.
Take profit
You can set take-profits before the trend changes.
Bearish trade setup

It is the polar opposite of the bullish version. When looking for a bearish Marubozu, you also need to find the candle in an uptrend or downtrend. In case of continuation, you need to find the candle in a downtrend. On the other hand, in a reversal pattern, you need to locate the candle in an uptrend.
Best time frames to use
Again there’s no definite time frame for pinpointing or taking positions for bearish Marubozu candles. You only need to apply a longer time frame for identifying the pattern.
Entry
You can enter at Marubozu or at the candle next to it in a bearish setup.
Stop loss
You can set SL near the high of a selling point. This can be near the high of Marubozu or a recent high in general.
Take profit
You can place TP before the trend changes.
How to manage risks?
This is one of the most important aspects of trading with this technical tool. The best way to manage risks is to trade using stop-losses and take-profits. This is because these orders protect you from any wild price swings.
When you find Marubozu in an uptrend or a downtrend, chances are prices can go in either direction. So, take-profits and stop-losses are key when trading the pattern. Let’s define this with an example.
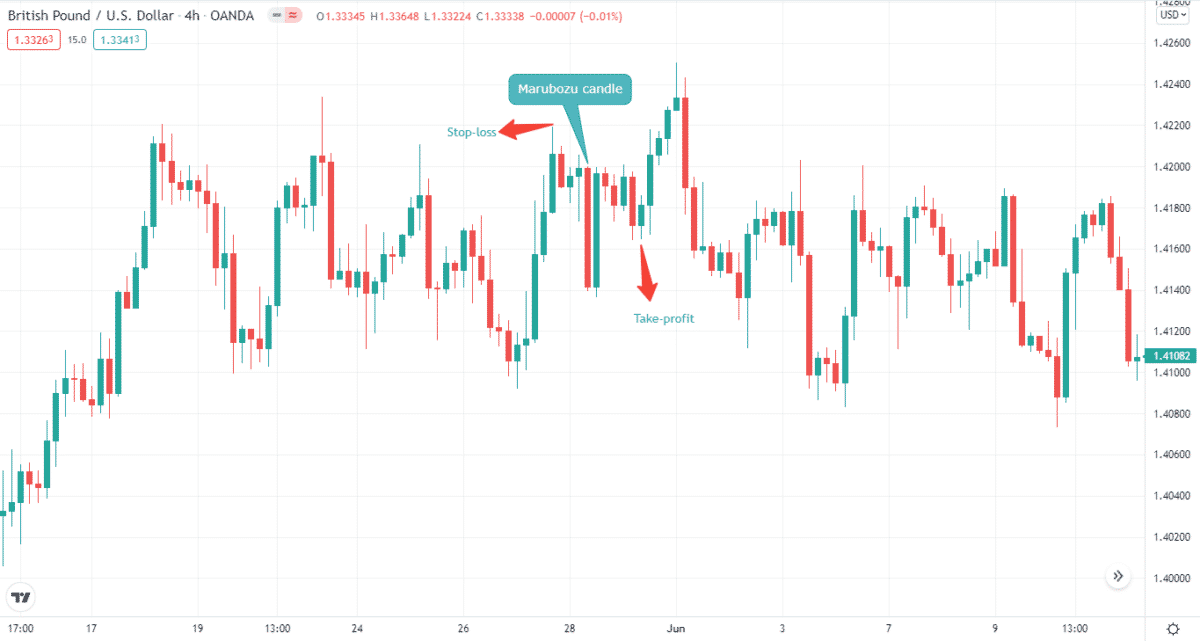
You can see a bearish Marubozu candle on the chart. You can see the price make highs and lows. You went short and placed a stop-loss near the recent high and take-profit near the low. If you hadn’t set a stop-loss or a take-profit and let the position ride, you would have ended up in a loss.
So, that’s why setting take-profit and stop-loss orders are essential when trading the Marubozu candle.
Final thoughts
These candlesticks are very useful for identification as they often inform the technical analyst that the market is moving intensely in one direction.
Bearish candles indicate that sellers suppress buyers and push the market down. Conversely, bullish candles suggest that buyers are in control and are pushing the asset’s price up. This way, you can see which side of the market dominates the other.
These technical figures are incredibly reliable. In all of the examples illustrated above, you can see that the market continued to move in the direction indicated by each candlestick. However, nothing in technical analysis can be 100% guaranteed.