- What is a strategy in FX?
- What is the best strategy to use in forex?
- How to create a profitable trading strategy in FX?
A forex trading strategy is a method you will use as a trader when analyzing a currency pair, looking to find an opportunity for buying or selling. Depending on your orientation, you may employ technical or fundamental analysis or even both. While you can utilize and build on any trading strategy available online for free, you can develop your strategy based on your understanding of market dynamics.
In this article, you will learn the making of forex trading strategies. From a basic market concept or observation, you can develop a simple trading strategy that you can refine over time. Here we will discuss a market phenomenon familiar to many traders.
How to develop a forex trading strategy
You can quickly develop your trading method, which often starts with a simple concept that many traders accept as true. Perhaps you have heard or read online that price returns to its average after it has pulled away from it for quite some time. This concept is widely known in the industry as mean reversion. From this one idea, you can build a robust trading system.
Here we will develop a trading strategy based on the concept of mean reversion. Our purpose is to help you understand the process of creating a trading system or plan. To develop a mean-reversion system, you will generally use moving averages (MAs). Looking at your charts, you can see that price moves around, up and down, relative to MAs.
- First, you have to decide how many MAs you will use. Typically, you will use one, two, or three MAs, but not more. Otherwise, you will make your chart messy, and you will not see the price movements.
- After this, identify the periods of MAs, such as 100, 200, 400, or something in between.
- Finally, figure out which MA to use. You can try various types such as exponential, simple, weighted, smoothed, hull, Tillson, etc. To simplify, you can start with an exponential MA.

Defining entry rules
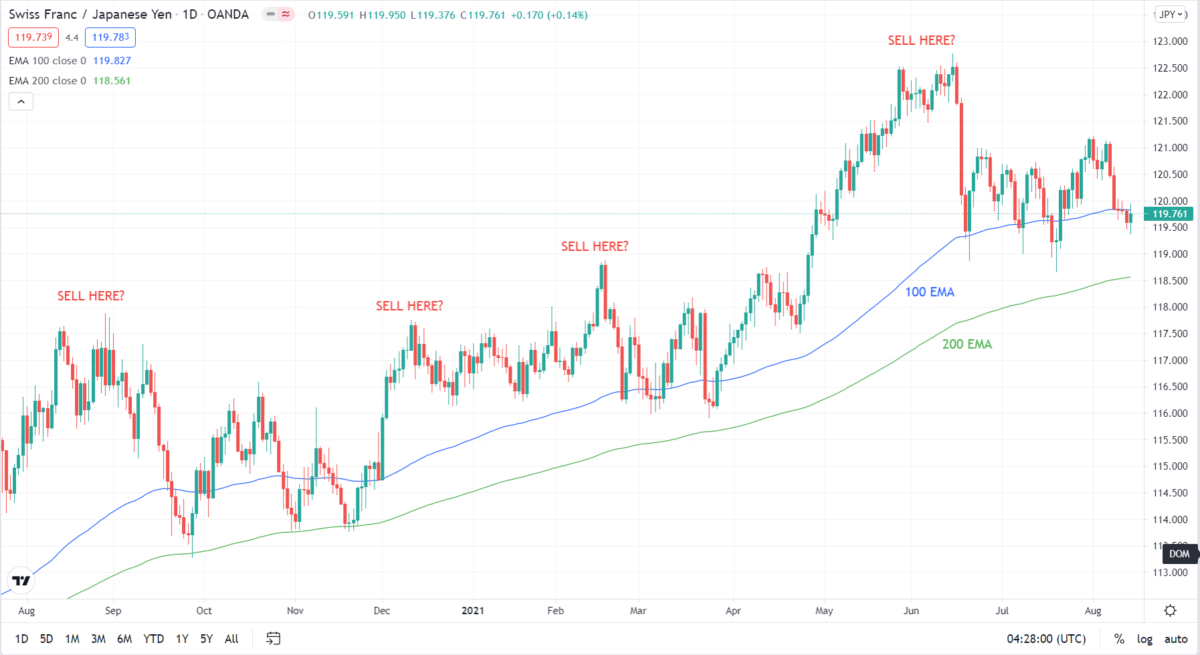
Consider the above daily chart of CHF/JPY. We have plotted two moving averages: 100 EMA and 200 EMA. We can tell qualitatively if the price has drifted too far away from the average with this setup. However, this is not enough to define trade entries.
There are four occasions on the chart where the price looks overextended, but our judgment is subjective. Therefore, we need another tool to refine the trade entry even further.
Here you might need an oscillator to give you overbought and oversold signals. Your choices include, but are not limited to, the following:
- Stochastic
- Relative strength index
- Traders dynamic index
- Detrended price oscillator
- Commodity channel index
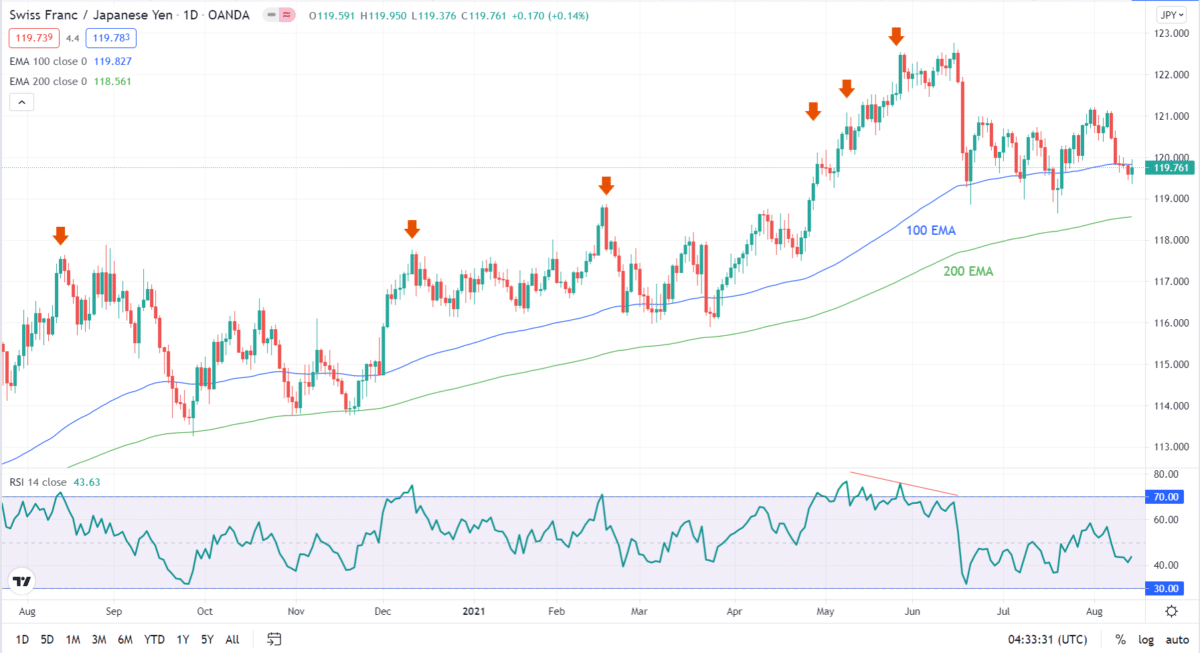
Let us use RSI in this example. To get a signal, you would like to see a scenario wherein price has moved too far above or below the MA and RSI gives an overbought or oversold reading.
You can further specify that you would take a trade only if the market has started reversing your entry rules. Hence you may use a bearish or bullish candle as your entry trigger, such as engulfing candle, pin bar, etc.

Now consider the same chart with the two moving averages, and RSI plotted. Note that the trend is bullish, so we will be interested in selling entries for the mean-reversion strategy. In this setup, you can tell objectively if the price is overbought or not, and it happens several times in the chart above.
Since we are trading mean reversion, we would like to see an overextended upward movement with RSI overbought confirmation. Once RSI goes above the 70 level, the price is considered overbought. Then you will wait for a bearish candle to trigger the trade.
Defining exit rules
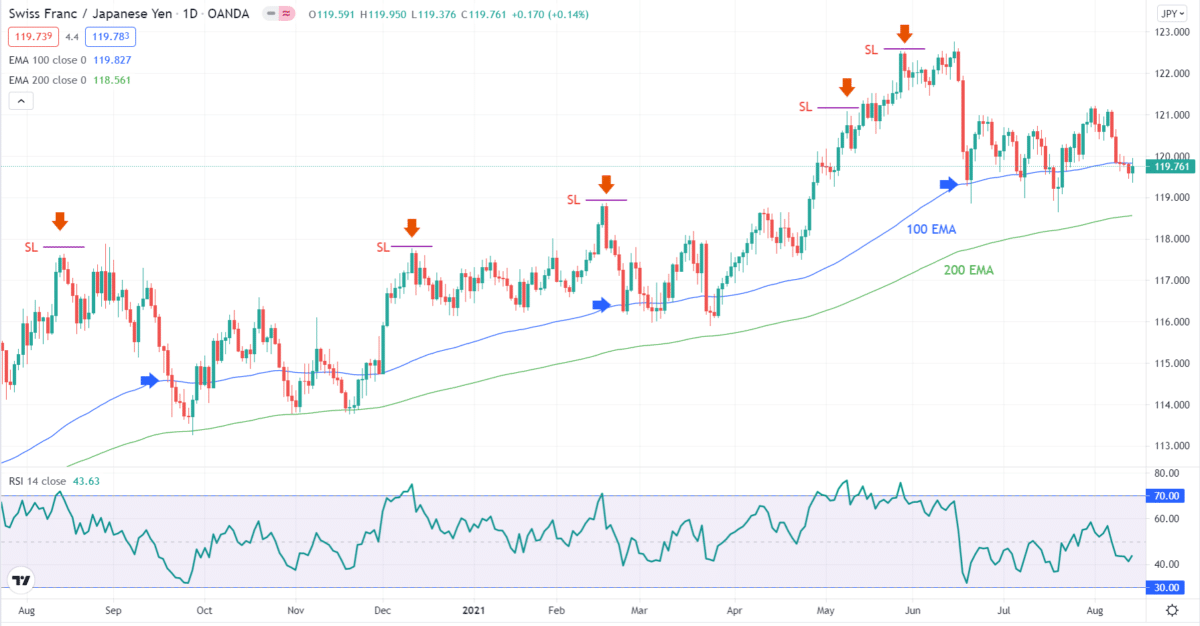
After you have defined the entry rules, you must define the exit rules as well. You may set your stop loss at the highest high of the last two candles for this type of entry. Then you can place your take profit at a distance that is two times the stop loss.
Another option is to set the take profit at the nearest 100 EMA. That is, you will close your sell trade when the price touches the 100 EMA. Let us use the second option. You might need to adjust the take profit target if it takes too long for the price to hit the 100 EMA. Alternatively, you may not set an actual take profit but instead, wait for the price to touch the 100 EMA.

We have labeled the stop loss and take profit levels on the above chart. The blue right arrows show the take profit levels. You might have lost money in the first, second, fourth, and fifth sell entries for the stop loss because the price retested the highs. Then you could have made money on the third trade. If the win percentage is low, as in this example, you can refine your strategy to find optimal entries.
Refining your rules
Here are some improvements you can make to this system. Use another oscillator to define overbought and oversold conditions. Replace the RSI with TDI, for example, and see if the latter is better. If not, find another oscillator and test again. Also, you can use a close-only stop loss. This means that you will not place an actual stop-loss order.
Consider the first sell entry above. Although price touches your stop loss level, it does not close there. It closed below that level and then went down. If this is your exit rule, then the first trade would become a winning trade. Whatever you decide to do, make sure you write it down in your trading plan.
When to move on to another strategy
The process of developing an FX trading plan can be time-consuming. Although it is easy to write down the trading rules, your trading plan is not done unless you put it into action. During the implementation of your trade plan, you might need to tweak some aspects to accommodate new information. You might come to realize that another setting or indicator is better. You might have made some assumptions that the market proved wrong.
In the process of developing your trading strategy, you might find out that the system is not profitable in demo trading, despite making some improvements. You might conclude that the system does not work, and it is time to move on.
But before you do, there are things you must consider:
- Risk-reward profile
Determine the risk-reward ratio of the trade setups generated by your system. Will the ratio give you a chance to succeed over the long term?
- Win percentage
Determine how many winners you can make in every ten trades you take. If you can only win four trades or fewer, see if the risk-reward ratio offsets the low win rate. If not, then you can say goodbye to your system.
The two factors above actually work hand in hand. For example, if your win rate is low, say 30 percent, but your risk-reward ratio is high, say two or more, you can still trade profitably. Meanwhile, your profitability is questionable even if you win 90% of your trades but gain fewer pips in your winners and lose more pips in your losers.
Final thoughts
As you might have figured out, it is pretty easy to develop a trading strategy. You can create one using a combination of tools. When you use multiple indicators, ensure that each indicator complements each other and not one of them gives a redundant signal.
After you create a trading plan, you will need more time to polish it through demo trading. If your trading plan fails to strike a good balance between risk-reward ratio and success rate, even if you carefully follow your rules and make refinements, it might be time to leave it behind and start all over again.