- What is the Butterfly pattern?
- Why is it worth using?
- What are its bearish and bullish setups?
The Butterfly is a chart pattern that belongs to the harmonic pattern family. It marks price reversal and is often seen at the end of a longer price move. The pattern gets its name because it has five extensions and forms a butterfly-like structure.
What is the Butterfly pattern?
When it comes to patterns, one name come to attention repeatedly: H.M. Gartley. His harmonic patterns are famously associated with chart reading, and they are still in use today as they were in 1935, when he originally outlined them in his book Profits in the Stock Market.
Although there are several note harmonic patterns, such as bat, crab, shark, and Gartley, butterfly patterns are the most common. The butterfly design is a four-legged reversal pattern. In the sense that it’s designated XA, AB, BC, and CD, it’s comparable to the Gartley pattern.
It helps in identifying the consolidation of a price movement. Hence, it allows you to enter the market when the price reverses.
There are two types:
- bullish or when you buy
- bearish or when you sell
When it comes to employing Butterfly patterns, general precision is essential since precision helps avoid errors.
The Butterfly and Gartley patterns have four legs and five points in common. The primary difference is that point D is placed at the extension of the XA line rather than the retracement. Hence point D is higher than beginning point X.
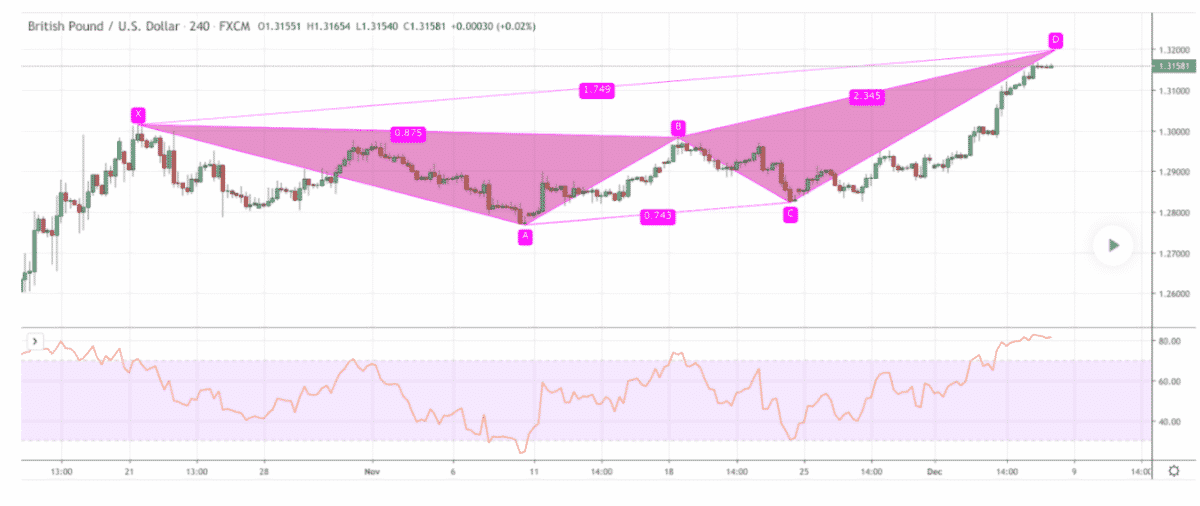
Here’s how Butterfly’s structure looks like.

An “X indicates the beginning of the pattern.” The four price swings of the formation are marked as XA, AB, BC, and CD.
How to identify the Butterfly pattern?
It is a four-leg reversal pattern, much like any other harmonic pattern. The Gartley Butterfly must follow the Fibonacci ratios.
The B point determines the overall form of the butterfly design. It determines the structure of the Butterfly. It can also act as a starting point for other metrics. The pattern’s structure determines the pattern’s trade opportunities.
Before trading the Butterfly harmonic pattern, make sure it’s real by using the criteria below. It must include the following essential elements:
- AB = 78.6 percent of the XA leg is an optimal target.
- BC = 38.2 percent minimum, 88.6 percent maximum AB leg Fibonacci retracement.
- CD = is a target between 1.618 and 2.618 percent Fibonacci extension of the AB leg and 1.272 to 1.618 percent Fibonacci extension of the XA leg.
Why is the Butterfly pattern worth using?
This pattern depicts a trend’s significant highs and lows. It is normal to see multiple butterfly designs appear in different periods, all near the conclusion of a trend when employing various time frame analyses.
An extension pattern occurs when a Gartley pattern validates by the CD wave passing through X.
This pattern may be bullish or bearish, with the bullish version advising traders to purchase and the bearish version reporting traders to sell. Precision is crucial when using the pattern since it helps traders avoid making mistakes.
Bullish trade setup

Keep in mind there are different strategies for trading the Butterfly pattern, so you should apply the pattern according to your strategy.
Best time frames to use
Although there’s no definite time frame for the Butterfly pattern, it can generate false signals on more extended time frames. So, it would help if you combined the pattern with indicators like the RSI and MACD.
Entry
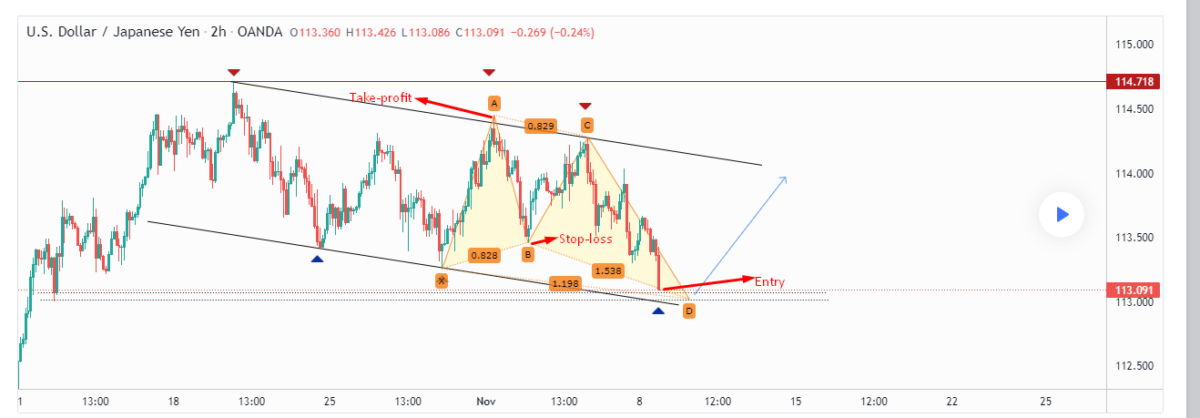
Determine where the pattern completes at point D. It’s at the 127 percent extension of the X-A leg. You can take an entry point after completion of the D leg.
Stop-loss
You can set SL near the low of buying point. It can be near the low of leg D or a recent low in general.
Take profit
To have an aggressive profit target, put it at point A of the pattern. For a more conservative profit target, put it at point B.
Bearish trade setup

The bearish one surfaces when the X and D points are placed above the A and C points, creating an inverted butterfly pattern from a bullish setup.
Best time frames to use
There’s no definite time frame for pinpointing the bearish Butterfly pattern, so you need to combine it with indicators like RSI or MACD.
Entry
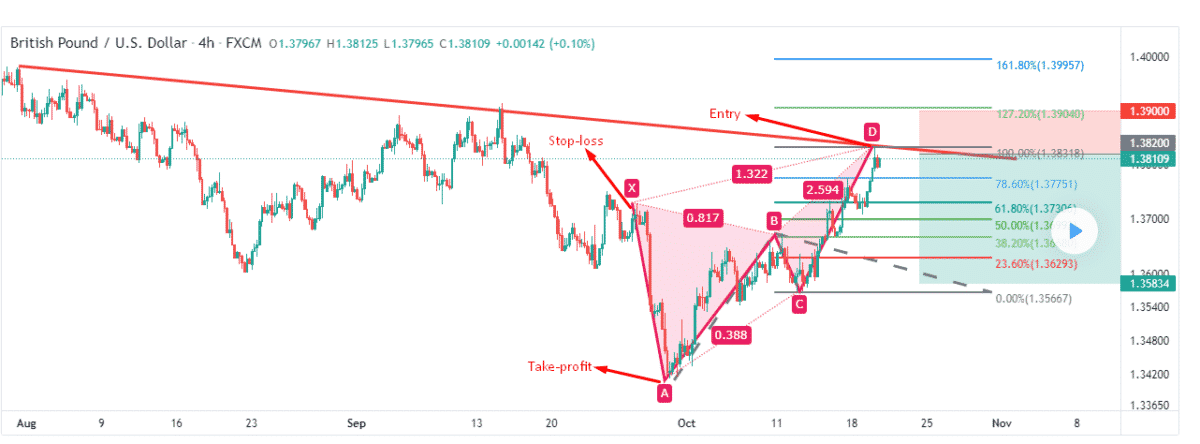
You can enter point D, a 127 percent extension of the XA leg.
Stop-loss
You can set the SL right above an extension of 161.8 percent of the XA leg.
Take profit
You can place a profit target at either point A (aggressive) or point B (conservative).
How to manage risks?
When applying this pattern, you need to use stop-loss and take-profit to manage risks. Because the Butterfly pattern is difficult to describe, there is a risk of false signals if the pattern is defined incorrectly.
As a result, you should use a stop-loss order. The D point is the lowest in a bullish Butterfly, for example. Before entering the trade, figure out how much risk you are willing to take. It is better to take profit point should ideally be set at the level of point A.
Depending on the market circumstances, you might close the deal early or increase the level. If the market corrects at point C, you can close at least a fraction of your position and use the second take-profit target.
Final thoughts
Although hard to find, this pattern is a fine indicator of a reversal. As a result, the pattern is what traders often look for as it provides a clear indication of price movements.